Sunday, November 08, 2015

Price Action Strategies for Beginners l Trading Reversals And Rejections

Swing Trading Reversals and Rejections Hi!
Blog has not updated since last few days, the reason was end of the months and lot of action and also my busy trading schedule.
There has been lot of talk around of ECB Stimulus and momentum again shift towards the US rate hike after the tremendous and healthy NFP report, which has given new hopes to US population to see the first rate hike in about more than a decade.

I am really in favor of rate hike because since US decide to end stimulus and bond buying program the only reason that they don't lift-of was unemployment and housing market and both of them has decent or say excellent recovery and now the Yellen and Fed members has not too many things to think about and coming Christmas would prove to be the gift of Rate hike.

Now, I would like to tell you that I have just recently decide to put some charts on board, which has really moved a lot out of large consolidation and given new opportunities to everyone but those who still looking for another technique may be still for methods that they can adopt to give kick start to their trading which has not happen for them in years.

Ignore Demand Scenarios and Price Action Basics


In the chart below, gbp/usd has shown us the big way we should approach a technical chart and we don't need to put any Indicator on the board, to succeed and to see why Price behave in such a way which can give us some idea how price use to behave violently when it revisits such areas.

Take a look at the chart Below


This chart has everything, whether you talk about Ignored Demand and retest after buy orders and If You want to trade support and resistance there was flip at lower high and then decision made again and You do get a clue that If there is lot of supply in the market market does not really wait for a pause and recent drop in Sterling is 550 pip drop and from decision it has already drop 250+ pips.

But what was crucial for me, a clue prior to release of NFP which means BOE policy decision was most important and single currency pair need local or individual guidance more than it depends on relative cross which was in this case and that is a big lesson for traders who like to trade only dollar and concern about what is happening with another global economies and that is why usd/jpy moves a lot when NFP data released.

Tuesday, October 27, 2015

Trade Currencies Like a pro

How to trade Currencies like a pro


I will Try and Update the Chart Later.

Possibly I would update another  chart to trade prior to release of FOMC Meeting Minutes On Wednesday.

Trade Safe


Sunday, October 25, 2015

New video of the Series l How to define Price Action Zone

Price Action Zones in Currency Trading

This is the new video of the series and video of just I have just posted with my previous article. This will you give better idea in understanding the whole concept and visualize those areas which are of high importance and on which whole trading has been based.

How to Trade Buyers Trap In Forex l Institutional Supply and Demand Concept

Here I have built up a strong article and chart where We can spot the strong Institutions behavior . Specially where we have seen strong Institutions and smart money behavior.

There is not denying the fact that some areas are of utmost importance and when those areas hold there has to be a strong logic or meaning of price breaking or faking the zone. In such cases, we should watch the behavior with second test and consumption of supply and demand.

This Chart clearly is an example of that trading is not a science, it is an art which can be master by strong conviction and dedication in understanding what Charts are trying to tell not what other factors or factor that decided the nature of price action Movement.

Price Action itself is a term defined for reaction to a particular zone, It is not a combination of several candle or candles, where we see pinbars or set of rejection candles fitting well into context then we must see strong decisions based on the after the rejection happen.

In this chart in itself, we see some strong rallies which complete ignored and when such rallies are ignored, there are strong set of pending orders or buckets remain unfilled, and when price retest it again and that rejection is strong then opposite demand of supply is tested and when it got faked then there is reaction that is needed at the supply and that is what exactly makes me a chart lover, when everything happens with such strong synchronization.


Take a look at the chart first,


Where we can spot such behavior, we should first see how price behaves price completely turned from the zone, and when price tries to retest does it clear all demand buckets, the answer is yes, because strong demand off the bottom is tested and fakeout . The last point is rejection and it itself is a strong one, which should be the point of real concern when it faked out the high previously and recent swing high.

Thursday, October 22, 2015

S/R Flips helps in Decision Making

We have seen lot of consolidation ahead of ECB Policy decisions and price holding crucial support prior to the release but what happen was the strong bearish price action unfolds and that happens when we seen demand hold and  Consumed whatever demand there was and followed by strong sell-off

Chart will give you better idea what I am trying to mention in that article.


I will update with more charts matching the context and tell you How price action unfolds prior to that strong sell-off after there was rejection at the top.

Wednesday, October 21, 2015

Candlestick Traders But how much Truth behind Candlesticks price Action

Price Action and Candles

Hi, Traders

I have just recently spend so much time on the research how candles help in spotting of a trend, but I honestly did not find so much to work on or even think about depending on alone candlesticks patterns.


But that is truth that candlesticks forms a strong trend and starts with a pattern but If there is no patterns or context in sight, then they are very hard to find out.

Support or resistance rejection pin bars are very hard to spot because they will signal about the trend which has already mature or not too much to travel and that is why there are not reliable but when price is about to reverse they forms a setup at top or at bottom, but if they are too heavy and demand large stops then there is no point in looking it again for smaller risks as they often let you follow the trade more often than not.

I have recently watched Euro/Dollar daily chart with supply and demand point of view and including candles in my setup as a help but did not find any suitable setup and find out how pinbars fake the price action so many times and stop hunting followed afterwards.


Euro dollar setups and Candles Prophecy


If you rely on candles then we see a rejection at the breach of resistance and we saw a follow through but wait is this setup is telling us the bottom is eyed which is the origin, then why we see so many quite sessions after we see a sell-off signal at the top.


In the chart above, I have recently spot a continuation or pullback entry but lot of traders won't agree with me, because they will look to sell at the retest and failure but it already has done the same as the recent price action unfold. And usually we see sudden change in the volatality and price breaks so many barriers.


Monday, October 19, 2015

How Institutons and Banks Trade Ignored supply And Demand

How to trade Currencies like Banks and Institutions
Hi, First of all I would like to request all of my blog readers that stop spamming my email and blog with fake comments or try to catch my eye for personal attention, I already told you that I have limited time and In between that given I have to post, trade and keep replying emails. So, I would request to take note of each and everything that is mention on the chart try find out videos On youtube and explore the Videos page of the blog.

Trading like banks and institutions is something that works in the long term and You have to take quick decision or market take quick action while following retests of the previous failed buckets of demand and supply.

These buckets could be placed at ignored demand or even at ignore demand but We should not blindly trust the retest would be Fakeout as it can work otherwise if there is not a quick decisions made by market to complete reverse after retest. Even if it reverse then the complete structure from that low or high would match the criteria for longs and shorts and then any conclusion can be find out.

Ignored Demand means Institutions Behavior when Price Retests


This chart explain it all but we should be consider few points before taking any decisions which are the S/R flip, whether price broke the last support after breaking the demand and retest it, Or price found new demand before retesting and how price behave after the retest. In the above chart after retesting and consuming the supply price compressed into demand zone and completely faking the swing low and demand below that low which is strong sign of Institution behavior at buying low and when price fake that swing high and supply above then this would surely clear ideas of supply orders are being consumed and there is a chance of buying could been seen at retest.

Most of the time when price found new support and start rising quickly it pause for a while and that areas are very crucial before rally and price could completely fake these areas when it come back to check the frequency of left orders and react if there is buying interest found and that is exactly happen in this scenario.

This chart is complete package of consumption and distribution as we found new area of concern where price found demand and it was again completely ignored and we see some stacked demand when price retest the area and then fakeout that swing low and straight into the last demand and faking it out and give us another perfect opportunity to buy at the recent lower lows and these are the least risk taken in trading but it need practice and complete awareness of the scenario and when specially when price has recent history at those locations.

Wednesday, October 14, 2015

Gbp/usd Update Looking for Much Higher Targets.

I will update the text later, Chart is updated with  Fakeout of previous demand Pockets and Price looking for another Decision point.


Yesterday I lost about 100 pips on Aud/nzd trade but there are no regrets but we should always respect every market move and market compensate today with that trade. I was busy analyzing the sterling chart, So I update late but still there is potential to make much more or even wait for next update. I would surely be looking to see reaction at demand levels right from the bottom if Price reverses or I expect a consolidation and accumulate this big move .

Price Action always a challenge but not for those who knows that price will certainly create few bugs before moving strongly and yesterday reason for downrally was never specified in any cause because supply was already consumed I really expect a move at demand or fakeout to give me least risky entry and It happened so quickly that I took couple of entries in a hurry with two pending orders at previous decision point which was ignored.


I will update the text when the session day trading sums up.

Monday, October 12, 2015

Why do trader Overanalyze too much rather than Look for Quality trades

Effect of Overanalyzing and How to avoid it

Hi, trades My last post of Crude Oil does not pick up from the new demand but It will be updated again as We will now look for failure or Fakeout at the top of trend If an opportunity would be provided I would update the blog.

Over-analyzing & trades & there subsequent results will leave most people in a situation of no action, or what we like to call Analysis Paralysis. You’re going to make mistakes in trading as well as life as there would be much more stress if you look to compensate for your earlier losses as a result of anlayzing charts too often.

There is no doubt that professional traders has a lot of edge over novice because there learning capabilities from mistakes, and to never repeat them, as they are more commit to the process and they move ahead with confidence & with much more enthusiasm.

Loosing and winning are part and parcel of trading or any other game. But like other sports or game you can keep loosing & in the end you can still win the game. Traders forget to take into account all the other events a and plays that preceded that moment which also had an effect on the outcome of the game. Just like the aforementioned example, trading successfully is the sum of a lot of small things and decisions taken over a prolonged period of the time that can bring success & overall profitability over a long period of time.

Trading Opportunity Of Aud/Nzd With the potential stop and Target


Pair Aud/nzd
Entry 1.0950
Stop 1.0850
Target 1.1200

Trading should be based on Probabilities that works according to plan

As I said, In the above example that I never Overanalyze the charts too much,as crude setup was only valid if Price got rejected and we trade that fakeout after confirming the new high but it did not play according to plan.

Quality Traders Learn from such mistakes and never mess with charts of setup too much and we as a trader should not look around when things go wrong and still looking for trade setups out of failure trades.

I often look at charts at the end of the day and as the daily trading sums up, I found another setup but It has much more to go as setup is already got rejected from current supply level and still I think has much more to travel than it has done so far.

Saturday, October 10, 2015

Week Ahead Update and Substantial Crude Rally

Crude double bottom and Strong rally Hi traders,

Its quite a while since I last update my Blog, but there has no price action to follow except recent Crude and Riskier Assets rally and there could be medium or long term bottom be placed, and the biggest clue is recent rise in rally of Crude is the biggest weekly gain since the late 2009 in November.


Big Clue was the recent Canadian Dollar strength across the board and that has to happen when crude and Canadian dollar are strongly negative correlated Currencies and Riskier Assets Like Aussie Dollar and Its counterpart Cousin Kiwi dollar recent rally is quite a big clue as We have not witness such rally in the past six months or so.


Let's begin with Crude Daily Chart, as they said there is clearly strong double bottom that failed and then with a break below that bottom we witness strong rally and that is bigger clue that stop hunting below the low was the reason of the last decline.


WTI Crude Hourly Chart Update


Basic Idea of presenting or posting charts like this is to let trader's know that what is true price action which demand or expect reaction. Reaction only come If price structure is designed to let everybody aware of the fact what charts are telling us. Now, simple scenario will be the Price test the New Demand zone and get rejected with strong volumes which will surely mean that there are new cash inflow and they think that crude is very cheap and should be good price to buy as it got rejected from previous levels.


If You like the post please don't forget to Share It
Watch How I Trade Euro With Supply and Demand Rule

Friday, September 25, 2015

Significance of Consumed Demand And Supply Zones in Currency Trading

Consumed Demand and Supply Zones In Forex Trading _______________________________________________________________________________________ Category : Supply and Demand Zones and How to use them

Tags : Supply and Demand Zones, Supply and Demand In Forex Trading, S/R flip zones, Decision Making on Demand Zones, How to trade Ignored Demand Zones.

________________________________________________________________________________________

As it clear stated in the Article heading that What are real supply and Demand Zones and How to trade those areas which are either consumed or retest.

But Most of them are interlinked with each whether they are New Demand or supply areas, or whether they are already consumed zones.


Real time Example of Consumed and Ignored Zones in Eur/jpy


I will clear these ideas in the weekend with more articles and with clear and neat examples with explanation and help you in identifying those zones to trade them successfully to know how strong money take valid decisions based on Consumed and Ignored supply and Demand Zones.

Tuesday, September 22, 2015

Price action from Higer Time to lower Time and Eur/jpy Shorts

Price Action Reading all Time Frames

Reading price is not a science, But still we have to bring in techniques which is indeed needed to read price action. Price is fractal and there is no fact that is moving sharply down on one time frame and rising on other, It will keep moving in the direction with orders coming in If there is an Institutional Orders are still need to be triggered . But as activity can be spotted on lower time frames, higher time frames should always be supportive otherwise big players can really drive the price to next decision point.


Recent Price action spotted in Eur/jpy on Friday was the real game changer because as I spotted there was some strong synchronization from daily to h1 time frame and price was looking for a trigger to fall which happens just before the market was about to close prior to weekend. That sell-off continue when market open on Monday, and I have try to cover cover all the activity in the chart below as I have emphasis lot on decision making rather than look for trading opportunities in every strong movement.


Decision making has to be there From higher to lower time frame but If it spotted in lower time frame and we saw some strong selling or buying on higher then we just only need a trigger with small risk to spot an opportunity and trade the trending market or even caught reversals at right time. Approach should be there and consciousness is the only difference between making money or remain on sidelines when you should be trading.
Lets look at few examples of the shorts I took On Eur/jpy

We have some strong decision making process in h4 charts, the area I marked with grey box is the decision making process but how market approach it was crucial . At first attempt it already fakeout the first decision point and then test it low approach or can say compression and finally made a new Lower Low. The area of concern is the upside rally has two decision points in which One is consider to be a pause after first rally which was tested already and second was that next demand of that DP was ignored on its way down.

Now For me I would surely be watching the price for next couple of days, how price approach that ignored area of if price found something substantial at the lows and If it did then I would surely look at the pressure on buyers when they buy it low, because remember there is always buyers at lows, but we have to see the pressure how they buy or take the price to next decision point to sell it at the higher price which for me is the way institutional orders hit the market.

Tags:Price is Fractal, Price Action Techniques, Eur/jpy Updates, How to read price charts, Intraday trading techniques, Forex Intraday trading, Live Currency trading

Saturday, September 19, 2015

Support And Resistance Or Supply and Demand

Why support and resistance are Not supply and demand

Hi, First of all I would like to remind about my last update, of Eur/usd where I mentioned that Euro is sitting on weekly demand and pair rallied to 1.1460 and that is why I always it is really worth to taking weekly and high time frames into consideration.

Now, the question arise here whether supply and demand are the same as term use for support and resistance. Answer is simple and straight "No", because support and resistance have no concern for smart players as they use them for take profits and when we see again that those areas hold it could just act at supply or demand and that is why price turned at high reversal points.

I am hereby putting everything together in one chart and with a live example of eur/jpy where you can see that why every support is not support all the time and why we find strong holders sitting at high or low with the break of those small support and resistance areas.

Supply and Demand Vs Support and Resistance


Its about decision points after we have seen some strong areas of demand and supply ignored and Reaction when price again approach those areas. In this case We have some history but that history won't be considered as valid untill we see another approach to test the borken areas. Price made a lower high after strong decision points marked as fresh demand with the blue box but price reacts well before it and compressed to ignored demand (second one). We saw a strong decision point through the ignored demand and price retest with new lower low was strong confirmation of pending sell orders and price reacts immediately and fall to test the demand formed and that is where I would looking to close.

Approach to support and resistance is difference between Pro and Novice traders and when you some history it has to be validated with context and when everything synchronize well with history then we get to conclusion that smart money is present in the market and playing the tricks and we just need to be conscious to get and entry stops and target.

Thursday, September 03, 2015

Euro sitting at strong weekly Demand Time to buy Euro against Pound


Euro is sitting at strong weekly demand and Bull should attack this area and This could be the last chance for the bulls to move the price higher otherwise bear attack would be enormous.

The reason why I am so much concerned about this chart is that because bulls has already given 1.5332 area which was strong demand zone and it was tested earlier but bulls failed to rally the price above the previous supply Area.

Now We should start buying Euro against pound as I observe that both of the currencies will start moving in the opposite direction and Euro will outperform Sterling in such a Case. So I am not putting lot of pressure on anybody as I am not the one who decide but what I can see weekly Imbalances and Now It is the time for the strong reversal to take place in euro against the point.


Wednesday, September 02, 2015

How to Find High Frequency Reversal Points In Currency Trading.

Buy sell Reversal points Hi, I hope everything is going fine as I try to stay away from blogging and trading for a month and in the meanwhile I didn't had time to update the blog as well. But, As I stated earlier, in my post How scalping can be benefited if You want less riskier entry and make money while less taking much less risk an swing trader does.
A reversal is not created on a day or two. While many new traders will look at a chart and see it as ‘overbought’ or ‘oversold’ market conditions but these two terms are rather a part of Emotions being Involved rather than any other defining reasons that a trader can work on for better trading opportunities.
There is a lot that goes into a top or bottom forming that can generate worthy trading opportunities, But how a trader can benefited from them as they rarely occurs on higher time frames and most of the Corrections don't ever turn into big time reversals.

Short term reversals can be a part of too much expectations as they are never a part of weekly or monthly chart. A true reversal requires ally or Collective Institutions feel same for the change in environment. Complete Change in Sentiments requires everything to fall in place and it is quite rare.


First, the fundamental backdrop must change on multiple higher importance news events by way of a significant surprise to the upside or downside. In an uptrend,The key point to be made up front is that reversals are more rare than we give them credit for and the small corrections, less than a reversal where multi-week lows are made in an uptrend, often aren’t worth trading. Therefore, when we believe a correction is turning into a reversal, we need to be skeptic and prefer trend continuation.

Lets take a look at few of the ingredients that need to accomplished to call a reversal or continuation in trend .

Usd/Cad update Close trade For +150 Pips.
Strong Ride as Expected, Not expected such a quick run.

Thursday, August 20, 2015

What is scalping or Intraday trading and How to scalp successfully

Scalping Techniques

I would post an article (not a post), but a complete article itself in the coming days where I would try to let trader's know How to scalp currencies. Scalping or Swing Trading are nothing but only techniques that requires practice and experience and all those myths that traders have or wrong assumptions that come to mind would be cleared with article. I would post charts with example and If an entry could be taken or what are the facts that you need to point out when you consider taking scalping or swing trading opportunities.

Starting with Euro dollar which I think is a safest currency and enough to provide you opportunities and clear level for Intraday trading and has good range on a given day. Euro is best to scalp because it is great sign of global sentiment and moves randomly with the global improvements and setbacks and that is why I always prefer Euro and Pound for Intraday trading although I always believe that trading any currency require immense concentration and it keep testing your nerves when it moves volatile but still a chance arrives when it fullfill few assumptions which has to back up by your trading plan


to be continued..............

Wednesday, August 19, 2015

How to read a Currency Chart With Euro Dollar Base was eyed

How currency Charts sometimes tells you in advance of Price Movement Hi all,
Its been a busy week so far and I was looking for opportunity but None was provided but today ahead of FOMC I saw Euro and pound chart Which I post earlier, and Now again I come up again with something that is worth looking at.

Reading Price Action chart is not a science, but an art and an art to understand in advance when and why a particular area is going to behave and when You know in advance and price react the same way then entry become lot easier.


See here
FOMC Statement and Pound Updates

Supply and demand traders are somewhat stay ahead of what other thinks and Recent Euro dollar example tells you all the story. We saw a strong Euro breakout and also saw a strong demand level which I market in the chart. Demand and supply are more than you can think of but I always mark those which are really helpful. Now, the idea is demand and supply levels are there to be broken but we can really spot out those who are going to hold and chart below is a great example of that.


How demand level in Euro Holds out


Although I sight reversal in Euro When it was fail to break above the multi-week high again after long ranges, But still I need further clues to make a statement that Euro has continue its Bullish Momentum and further gains are possible, But I never make prediction till I got a strong evidence of what is about to happen in the coming days or weeks.


Euro is vastly trading currency globally because of 17 Nation currency has lot of trading partners globally and they need Euro to pay for Imports and that is why Euro's exchange rate is sometime so vital for other basket of currency and they will move randomly with Euro, But One should not bet on that and Should have well versed with knowledge and skills to trade Euro or Currency that are positively or negative correlated with the Euro.


Reading Currency Chart is the Important tool to have as Its not only about indicators lagging or advanced, it is about reading Institutions or strong holders movement because they are the one who will move the market up or down wherever they want and specially when you have such big risky event one must be completely sure of taking and entry prior to release because when you take entries with the market movement then most of the time you get trapped and price mostly reverse after strong one sided movement.


This is a special skill that one should have to survive and think of making Forex as full time employment or money making opportunity but reading charts is must to have in your belt to keep growing as a trader.


Stay Tuned For More.

gbp/usd Update Before FOMC Statement

gbp/usd trending want higher prices values assets quite cheap


Sterling Chart has been updated and I have seen Values that want to push the price higher and some strong new cash flows yesterday but it still capped around 1.5750-75 area and once they are cleared, I won't have any other doubt that price will surely test the high and go through very strongly.

Just waiting for another FOMC Fed minutes to disappoint Market as they seems in no hurries but BOE seems to be in quite a hurry and next BOE meeting would be very crucial but I prefer to see values on chart and keep things simple and straight and I would be watching strong test of base again around 1.5640-60 area and then would be looking to see If price break the recent high for more growth.

Stay in touch
Trade well

Saturday, August 15, 2015

Euro dollar updates ? Is the rally substantial.

Euro dollar Rallies After Strong NFP data Hi, Traders
Is has been busy week since have post few trade setups and those which were post went fantastic and specially Where I have mentioned that reversal is on the cards even before the NFP data was released earlier this month.
I would be rather sitting on sidelines as Euro is very well bid up but rally from the highs is sending signals for a test of 1.1125 and below 1.1075 area But that's not important as Institutional Money is out of Market otherwise they would have went along with the break out and go beyond 1.1260 Barrier, but they give up earlier and took their profits and retailers are just moving the price in a range on shorter time frames.
How I spot Eur/usd Reversal when Last NFP data was released

Focus is now shift from risky events to expecting events and when that was happening when Fed start bond buying programme two years ago we see Euro rally a lot and the reason was simple that Situation in Euro Area was the same But the dollar demand was low because Fed did not want strong dollar as their focus was development and provide banks enough liquidity and safety that stock holders start feeling confidence in investing and feel much secure with their Investments in States.


That Bond buying Programm did wonderfully well and we see stock market is at the all time high's and Not even in US but through the world we have seen a rally since last two years. Now Time has come to provide more safety as Fed has create enough employment opportunities for its public and now we soon shall see rate liftoff and that is why September Meeting minutes are very important for Investors around the globe.


Friday, August 07, 2015

Trading levels of Gbp/usd l Price Action Analysis

Price Action Analysis of Pound Hi, Its quite a busy day with much awaited NFP which came just below expectation but as I mentioned in my previous post Eur/usd that Reversal in Euro could be on the cards,even though Unemployment Data came inline or more than expectation as long as 1.0870 level is protected and Now, I am waiting for Price Action to give me more clues of bullish momentum and I will update the Euro Chart If and When that happens.

This post is about Sterling or Pound dollar chart In which I am about to mentioned few crucial points of Price Action,First of them is that It traded in within a range since past few weeks and when that low was broken, price hurried up to go above the broken support.

Point of concern now is break above 1.5550 to give us strong indication that bullish momentum is again getting speed and we should look for long entries. But as I said we need a break above that level. To Sum up the things see the h4 chart with possible scenarios and How price unfolds beautifully as expected.


Price chart of Sterling


As You see in the chat price attack the line 1.5470 immediately after breaking the support gives us clue that price is ready to rise but we need bigger clues if price can break 1.5550 and we will get strong trading levels from 1.5470 to 1.5550 and then we try and look for possible long or short entry. But still too early to tell whether price action of gbp/usd is bullish or bearish.
Looking ahead 1.5610 is strong level and Price Action traders always keep in mind the possible targets when it hits the bullish momentum and possibly continue its way through and breach several levels to find its target.

If Price breaks the low of 1.5422 level then it would be a different story altogether as I would look for bearish entries if Price give us opportunity at higher levels to trade and short the pair after breaching the lows .
Price Action always tells us what to do and what not to do and how much you need to have patience and whether or not that patience is paid or leave you much more awaited for your next trade.


These are much important levels for Price action traders, As I mention in my previous posts that Supply and demand levels are the only true levels to trade rather than trusting support and resistance as we have seen so many times, Price breaks a support and rise with more powerful and break the resistance and decline with even more strong pace than rise. But Price Action is king and reading every time frame is very important to give you the entry and exit levels.


Stay tuned for more.
Trade Well
Happy Weekend

Thursday, August 06, 2015

Much Awaited Non Farm Payroll Possible Last one before liftoff

Euro dollar Update Before NFP Data Hi, This is possibly the last Non-Farm Payroll Data before Fed start lifting up rate till the end of 2016 and this should be the real cause of concern, But this market has lot to offer but nothing for those who are not conscious.

I am posting Euro dollar update With the Real time example of last move and what happened when there was talk of Greece exit and Euro rally over 400 pips, after the market open taking all the stops above swings high and low,But I would still be cautious and will not trade this report as I have market few areas on my chat which will be a due coarse of focus for me, and If price went as expected, then we could be in for another ride before the Next Fed Meet.

Eur/usd Chart Update With Possible Moves


I don't expect anything from markets as I hardly watch news but I spot the areas of concern on my chart and If I am right then I will possible turn to shorter time frames for entry. Euro is in pause mode since last few weeks, may be Market expecting a lot from data but possibly one clue was given when Employment cost Index data was released past week, which tells that employment rise only give 0.2% of the wages rise and which was much lower when Fed was rising rates a decade or so ago.


But Situation can change dramatically and we can see the opposite reaction, when data released but I am expecting something out of the blues, But never ever ignore what market offers or it does and stay alert on your toes and don't just push buy and sell button, till you mean to and when you have to.
Stay tuned for more.
Trade Well

Wednesday, August 05, 2015

Supply overcomes demand and finally Consumed and Bulls Ride The trend

Bulls and Bears fight as Demand overcomes Demand As I update you yesterday about my positions in Eur/jpy trade and you can check them by checking this post.

Further, I would like to put more light on the fact that Only Price action is what Tells you where price is heading, Trading with lot of indicators never gives you an edge, unless you know what is happening in the market.


Price is king whenever you trade and whatever method you adopt should gives you an edge over other methods and If You still don't know your niche in trading, you are not on the right track and only get disappoint whatever system you try.

I never Claim that I am trading with best of the strategies and Speaking honestly I would like to mention that I only succeed 30% of the time but what about rest 70% of trades, they all are Loosers but my Profitability factor is still 3 times of my average losses.

Have a look at previous Two trades As How accurate you can get sometime depends on how conscious you are about your system


Eur/Jpy Demand Overcome Supply and Drive the Market


Points you need to considered while trading or building a plan


* Versatile Strategies should be adopted as Market conditions changes every-time.

* Trade only logic and not Indicators.

*Whatever system you adopt, You should make it your own and add few unique enter and exit strategies.

* Don't ever follow your trade too much. You should know in advance what IT's have planned and why they should take your stops before moving in your favorite position.

* Price is the only thing you need to consider rather than trusted only bullish and bearish candles.
Stay tuned for bit of more help. Take a look at few of my previous posts.

How To make decisions in Advance in Forex Trading

Decisions Points in Currency Trading

How I pick short term Top in Euro

How to decide in advacne the Value of currency will be Rejected at several places

How to determine the Currency Price Its been quite an exciting week so far, with lot of happening around but the most important thing is that if we can something out of that market movement, Here I am about to discuss "How we can project that current Value will be rejected or not", As we all know this market is not driven by retail trades and hence we have on control what so ever as we Collectively move in one side and still we can't drive the market up or down at a certain pace, but still we can collectively facilitate the market.

It is up to strong holders that how to drive the market and how to keep those level interested, that everybody took their piece while we approach an area high low which is breached by strong movement either way, Specially when we trade supply and demand and the movement is so sharp that sometimes we do see few fake retest and value still remain up or below a certain barrier.

Let's take a look at trade of Eur/jpy I took yesterday


So, when you decide to trade such scenario, think in Advance.
* Importance of Level, How crucial the level is, means the rise and decline from the broken level should be strong
* How Price is approaching the level or retesting it . If price still very choppy in retesting then move to lower time frames for entry
*It's better to wait for first test otherwise that supply or demand levels seems to be consumed if we wait for second retest and still low values can spike out of anywhere.
*Profit margin should be atleast 2 time the risks and If you trade at higher time frames then this type of trades can go atleast 5 to 10 times of the risks, So better you trade those higher h1 or m30

Saturday, August 01, 2015

Charts that have Strong Supply and Demand Zones or Levels protected

Buying and selling Zones in Currency Trading
As I previously mentioned that You don't have to look out for historical price values as there is strong intuition that price might react or not react on a particular zones and chart that I have posted below really is a strong evidence that Strong Supply and Demand zones need reaction and those areas should show minor development areas or level protected after the breakout.

Strong Development Area or Demand and Supply Zones


Trading plan l Linning up currencies to Trade

How to prepare a plan to line up the possible trades for Coming days
Its been a nice Journey since I decide to put up this blog to help novice and new traders and even for experience traders. But some questions always do arise in trader's mind that what to do in the spare time or at the weekends when there is nothing to do.

Some traders prefer to spend time with the family, Other prepare their journals and most of the traders prefer to keep looking at historical price movements on Monthly and Daily charts for the possible setups.

I always mention on my blog that price turns and continuation is decided not in advance as most of them are decide as per sessions on Intraday basis till we have some strong holders keep moving the market for a week or for a month by most. Other trends built up take months to decide and still without the help of others no one can built trends for years or even decades and Price will keep facing challenges when strong trends tend to reverse or shortlived after strong run.

I am putting up lot of efforts as I prefer to stay in a trade for a day or two by most and won't enter until I get a strong confirmation of continuation because after a run there surely would be few sessions of consolidation or sideways movement and price take a pause before another run upfront.
As such it is not wise decision to line up pair which is trending to go and buy and sell immediately and one such example is the chart I am going to show in my upcoming posts.
This is a chart of sterling with possible turns with changes in momentum after the weeks starts before it shows strong run and reverse when the week start, which is in itself a strong statement that price turns are natural and Nobody controls the price no matter whether they have bundles of potential untill they got support from other holders.

Gbp/usd Reversals and Continuations


Most of you would think what is the reason of showing this type of values on chart, So defining conclusion is that whether we trust any historical chart or not, Most of the patterns give you returns as such only 15% of the candlesticks patterns do offer you strong reversals or complete reversals, So how wise is to test those patterns and continuation signals when the trading week sums up.


I would put up few more charts where you can decide in advance how to spot up behavior of strong money prior to price gets there but It should be part of strong imbalance and this area should have been development area of test once. It is just a matter to see whether to count a breakout is strong and has continuation power or it is just fakeout.
Stay tuned for another chart that offers you substantial return and activity is spoted and synchronize on every time frame.

How to Identify Strong Demand and supply Zones How to Trade breakaway Gaps and Importance of Gap in Currency Trading

Friday, July 31, 2015

Intraday Trading techniques l Technical supply and demand levels for Intraday opportunites

Trading Techniques that helps to scalp and swing trading Hi,
I have shared each and every technique I know here on my blog, you can check out the blog for any help and mail me on the address mentioned below in Intro section for any help personally.
The question arise here is whether supply and demand can help trader built a portfolio based on Intraday level. The answer is big "yes", because For me Chart is a fractal and every move from Minutes to Monthly being done on same approach.
So, it seems interested to everybody and feel excited that If we can spot trend on monthly and goto lowest possible time frame pick the swing break and then pick the lowest risk entry and target the swing high. So, the answer is you can but how and that how become possible if you select pairs that have clear demand and supply levels on daily or higher time frame and LTF shows the same synchronization with the higher.

Take Closer look at this Chart that will completely change the way you thing and that being proved time and time again and again so many times.

Eur/Aud Technical Analysis Simple S/D levels


This is complete treat when you see such opportunities and this is what we all live for is that one opportunity never go bagging and we make enough that always keep our interest and confidence upto the extreme level when we compete with the best of the lot.
It is important for intraday traders that they check pairs that are trending and have syncronization with higher time frames.
These are the few points that we need to understand
* Price should have protect the true demand and supply levels

* First reaction should be crucial and wait to see if price has engulf the nearby supply or demand level.

* Price must go back to test the existing levels specially when it react fast to the level.

* Test should be strong and that level which is tested should be fresh and not tested or consumed before that test.

Trading would be a treat if you consider such points and levels as mentioned in my chart.

Trade Well.

Wednesday, July 29, 2015

Euro looks weakest of all amongst its counterpart l Supply and Demand Zones

Weakest currency euro dollar Hi readers,
It was quite a silent month as far as currency trading is concerned even though lot of things happen in Eu and specially Greece. I decided to remain on sidelines and watch PA but there was no such trade specially my favorite pair Euro.

But, Today my shorts triggered right from the day start as we start seeing some weakness at the levels 1.1087, after we seen some fake moves after price try to break the previous fakeout zones.

The Chart I am posting today is the leading example how market orders get triggered and how price went in a zone and get rejecting immediately but still have some firepower to click the orders both way and then went in the direction of the overall trend.

Euro dollar chart With Supply and demand Zones


The Chart above is perfect example of behavior at various levels and when the direction is already decided and we just need to wait for big release day as it started right from the session start and selling takes over after asian session jump in the demand that was shortlived immediately after an hour or so.

Tuesday, July 07, 2015

Forex Trading Strategies l Beginners Price Action Based On Supply and De...

Forex Trading beginners price Action Hi, Traders
I have recently built a video on my Aussie dollar trade that I took and all the important information is mentioned in the chart. Bit sluggish, but that's all I have at the moment and Will surely built professional videos in the time to come.

But nevertheless Idea is to keep you all updated on How I trade and What approach we should apply in sideways market structure. One should always keep and eye on always watch the decision points and How price behaves when it returns to those decision points and Its really worth it to take a trade with limit orders when price returns to those areas and Price has rallied or lean away from those areas and market is very hesitated visiting those areas in adverse market condition or fear of things to come.


Aussie Trade Setup

Thursday, June 11, 2015

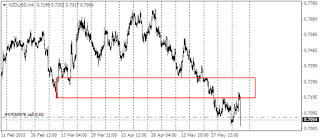
NewZealand Dollar Rate Cut by 0.25 bps l What's next

Newzealand bank cut the deposit rate by 25bps


After leaving rates on hold for 6 straight meetings, Finally RBNZ cut deposit rate by  25bp  to 3.25%. Dairy auction pricing has remained on the soft side and inflation expectations remain stuck below the 2% threshold, but the primary driver of the easing convictions is the announcement made with the latest RBNZ stability report. As expected the central bank sought to curb property inflation in the overheated Auckland area by boosting LVR requirements to 30% effective this October, thereby diminishing the primary deterrent to easier money.

<br>
- Along with decision on policy, markets will monitor the latest projections for growth, inflation, and 90-day bill rate forecasts made by the RBNZ on a quarterly basis. Last time in March, FY15 GDP was cut to 3.2% from 3.5%, CPI cut to flat from 1.1%, and 90-day billl rate target reduced 30bps to 3.7%
Reserve bank of newzealand cut deposit rates start Easing

Weekly Chart has lot to travel till it find the last imbalance point

Wednesday, June 10, 2015

usd/chf update l Possible Scenarios

Usd Franc Trade Updates Hi, Traders Its been a week since I have posted and I saw some strong movements in jpy crosses but they are not part of any technical moves because its more than fundamental that driving yen demand and pushing yen crosses lower.
It is not a cause of concern for me as I always trade what I see and I have seen some strong rejection of levels in Usd/chf and I don't care what Euro do in coming days or weeks I expect Euro to be lower and I have not seen any movement in Euro bunds which means strong or smart players are sitting aside and hence dollar demand can dominate any time.

Here is the Usd/chf chart update that I see


I will try and update as I have seen price flagging after rejection of strong demand and If this rally has to continue then we need another rally of that line which has some history in the past and I see only supply around 0.9440 so there is good amount of pips you can bag and risk is only 10-15 pips or psychological levels 93 cents which is just few pips away.

Trade Alert


Usd/chf trade closed with 52 pips. Check the updated chart with Trade plotter.

Friday, June 05, 2015

Englulf Candles l Power of One Candle

Power Of Engulfig Price Action

Trading Single Engulfing bars at Important Levels –
Trading Engulfing Bars only Can be Profitable

From today I will post daily engulf price action on Four Major Currency pairs and trade alert will also be posted. You just need to Stay Alert and watch blog from time to time for education as well as free trade alerts.

Eur/usd rally strongly from the base to origin of down move as It was part of Institutional trading that they set predetermined buying and selling areas specially when they use Engulf at Important levels.

During weekend, I will post Eur/usd Chart with possible Reversals with the help Of Engulfing Bars and other possible charts with trade entries and exit.

So keep checking the blog from time to time

Thursday, June 04, 2015

Forex Trading Strategy and Price Action

Hi, all

There are so many doubts in everybody's mind that If there is strategy that can make us consistent money and the answer is "NO", Because We all expected returns in big way and there are not too many day traders that fetch consistent returns unless who are having tons of experience and making that experience counts and knows their limitations .

It all about keeping things simple and Look to rely on simple naked charts to trade and keep a track record of your losses and wins and always use Money Management while entering and exit because Even simple RSI buying selling ratio should be good enough strategy to make money because when they fail you know when to exit and what are the chances of making a big trade with Strong money management techniques.

Question Arise from Expectations and when hard work don't met expectations then depression use to dominate and that is what the story of every retail trader and I am also the same.

Problem we face is that we check  so many social media networks with the same relative information and look  to search google  to see what is the best strategy and what is the consistent way of making money and We have to satisfy ourselves with bunch of traders are looking for the same sort of results.

I would advice you all to see the search engine with relative searches on the monthly basis on a same topic (say Forex price Action ) and you will be shocked  to see that whether there are people who know how to trade and the resources which tell them how to trade are worth it to give it a try.

I always believe in working alone or Same people working on same project but with divided  duties and every one should be answerable to his or her boss for the results and Forex is not the different because when we try to trade we always look for help and search or look out at forums for the views  and Trade Ideas of other traders and even do the worst loads lots of indicators for help to look for price action and see if it helps.

I believe in Keeping Your Trading Simple

The key to successful Price Action Strategy is to keep things simple. I am always against the complicated trading strategies and using lot of Indicators where you can hardly see the price or hardly consider price when you want to predict the price action. I used to trade the chart system like this :

Trading without indicators best trading strategies


In Simple words, the simpler your method would be, the easiest it would be enter and exit. Because if you rely on some indicators to react while looking to exit then it might react very late because they are lagging and always react to price.

My answer to all you complication is first open a naked chart and plot few support and resistance line and look how price behave to it when it touches or surpass them and there is no need to look way behind in reference to take a look at historical chart to catch the reaction.

I find that this is the best Forex strategy as the chart is clear and easy to understand and there is little to no noise distracting you from the price. This is one of the benefits of using a Forex system like this.

Japanese Candlesticks Patterns Do they help in Defining Trend Alone

Hi,
Most of the traders who follow my blog knows me what type of trader I am But I am also one of you who had torrid times trading and trade everything and First thing I try was Candlesticks Patterns.

 What is a Japanese Candlestick ?

While there is no need to explain this concept further as many of us are familiarize to this but I will surely dig in a little and discuss them more in detail in my upcoming posts.


Japanese Candlesticks Trading
Japanese Create their own old school Version of Technical analysis to trade rice. That's right, rice. Mr. Steve Nilson discovered this charting technique called "Japanese Candlesticks" learning from a fellow Japanese broker. Steve researched, studied, lived, breathed,at candlesticks,and start writing about it. and soon this technique became popular in 90's. To make this discussion short, without Steve Nilson Candlesticks candlesticks charts might have remained a buried secret. So, We can call this technique as Mr. Nelsonsticks.

Back in the day when Godzilla was still a cute little lizard, the Japanese created their own old school version of technical analysis to trade rice. That’s right, rice.

But Really If I ask you about my own experience then would you consider that Candlesticks patterns really help you define the trend, May be most of you really will raise your hands and say yes it did. But for me they do but not at all phases. Little movement at top will give some strong traders room to collect profit and again enter at better price and How would you tackle this type situations. Would you re-enter at second entry or consider first entry as best and would still trade failed test of top or bottom.

So for me, Trading alone candlesticks patterns is not the secret. Situation, patience and reason to Candlesticks is the best way to enter a trade.

Let me clear you with an example of Recent Aussie Chart .


See, Everything In trading is totally synchronize as Fundamentals allow trends to built and create a atmosphere where Technical are also supportive. For me, Its always been combination of Supply and Demand Areas and Reaction of Candlesticks when they reach or surpass the area and also the upcoming events that usually creates or reverse a trend..

But It does not happens everytime you trade because As I said earlier these all things are synchronized and I combine them with the recent market situations and demand and the speed of the trend on weekly and daily time frames and then I use negating techniques when price fall with the same pace it was rising and Candlesticks post neutral statges.

Gbp/usd chart that I posted last week fetch more than I anticipated and still looking for much more advance and I always recommend buying on dips even after Service Purchasing manager Index fall to 56.9 and It was expected much higher. But What happen with that bearish Engulfing pattern after the release.

Let's find out with the help of chart

Candlesticks bearish price action negated


So, Its quite clear after seeing the above chart that Candlesticks patterns not only thing to rely upon but situations and Imbalance is something that is driving the Price to one corner to other and this will keep happening on higher time frames and we just need to spot those scenarios where we can enter with low risk and chance of getting nice ride is much more than those large and strong fading candlesticks.

Tuesday, June 02, 2015

Gbp/usd chart Updated.

Gbp/usd Intraday Chart Updated First Of all I would like to remind everybody about my last month Chart Gbp/usd and take a look at the Chart Price has rallied to from that support which is mentioned in the above chart and Now I am still look for much stronger rallies towards 1.5800 levels where recent high is posted But that is not enough as I always look for strong levels and I would surely post the chart here again Once I saw any Institutional selling and Look to close all or part of my current positions.

How I trade Pinpoint levels in Gbp/usd


As You have seen in the Above chart, How I market levels in the chart and those are not just levels those are demand levels and Look How market approach to those levels.
It is Crucial from a trader's point of view that Market maintain Imbalance when It approached to those crucial levels and that is the fact which remains a secret to trading supply and demand and watch the last candle so strongly coming out of that lows tells us that you can't trust what you see as it take the stops of longs and Now people have to cover quickly out of shorts and looking to buy when breakouts occurs on shorter time frames.

Gbp/usd chart that I posted Earlier


Long Term View of the Gbp/usd


My long term view of Sterling or Gbp against dollar is still bullish because As you have seen I try to trade imbalance and Price has manage few swings in the past to fake the breakouts and that swing also is coming of lows of long term support and I am still looking for a move towards 1.6150 levels and there on I would like to see How price behave at those levels.

I am long from 1.5200 levels and still locked the trade at Breakeven and at no risk but still I would looking to trail my entry and start locking my profits as this counter-trend swing could be the strong off from the lows and one that rejects of from high posted a sell-off.
Eur/Usd Long term view

Friday, May 29, 2015

Australian Dollar Update Imbalance Spotted

Australian dollar update Hi, I have just recently discuss about Imbalance and then came up weekly chart of Euro Dollar

Australian dollar levels and spotted Imbalance


Australian dollar weekly chart has spotted a beautiful area of Imbalance and we have just recently open shorts from 77 cents area and that tells us that we can really get a ride untill price finds another support to rally counter trend and rally against the main trend.

What is Imbalance and How to define a trend with its help

<head> <title> Imbalance and How to spot it Its really being a point of concern to How to find a trend and How to maintain a discipline and look to bring some consistency in Trading. Well, this article is just going to help you find some crucial areas on weekly chart where you can afford to risk a certain amount of money and can really find a point where you can really enjoy your entry point and bag good risk reward ratio.

Example of Imbalance In Euro Weekly Chart


Now, we discuss what is Imbalance. Imbalance is what create trends and balance creates ranges between buyers and sellers. Now you might has idea what is Imbalance. Imbalance from a point to another point could be rallying and rejecting untill we find another level where strong buyers of sellers hunting for taking their profits and setting up for next moves.
As It is stated in the chart that Market start a new trend from high and fall sharply untill it found a support but then every rally is followed by sharp rally in the opposite direction and that is strong point we need to know.

Point is that we have to find an area where market start a new trend and rally against and then create a Imabalance which could be tested in future and resume the larger trend which is short term bullish and that's what has happened exactly.

Decision Points In Trading

Decision Making In Forex Welcome Traders

The point and topic of discussion today is How we find "Decision Points", in Forex. We all know that this currency market is driven by fear and we have some strong decision points which tells you about the history and price respect those areas and Market use to trap after collection Breakout Buying or selling orders. But the point here is how we can pinpoint those areas where market has taken a final decision and look to rally.

Decision Point taken In Gbp/usd Chart


Chart above shows us that Decision was taken after strong rally from bottom but it was taken at a very crucial resistance which had already cap the market

There was real chances that market fade away from this Breakout But demand was very strong and it rise from Historic Lows(Strong point as Historic Lows could be target of current rally)

Market could still easy fade away and start falling in the direction it was falling earlier and resume the trend but that decision was strong and market really ignore that in the first attempt and consumed the supply in the second

Market use to pause at crucial resistance making room for next moves or just sit here for days or even weeks but As I told you decision was made to breakout and when you see such breakouts after strong capped areas You need to start watching the charts as I mention in the text on chart.

Friday, May 22, 2015

Usd/cad at crucial resistance l Strong Reason for rejection

Trend reversal points Supply and demand trading


I will surely be trading this Usd/cad possible reversal which could give us seriously pips if reverse from this range-bound breakout and reacting to levels.

Because of the facts we have upper supply box at the top of price action and we have some strong Fakeout Bars which is still the strong supply to breach but the below separation point is strong enough to react to the lower boundaries marked and If My projection is right we could see a strong bearish momentum to reach the lower low and breach and strong bull trend could reverse completely.

I have market all the strong points on charts and this could lead to a very low risk entry but still we need confirmation and I would like to see one more test of the strong demand and then I will trade if price manage to breach that area and reverse to test the resistance once again giving me confirmation that price is  coming back to take the buy orders.

How I pick Short term Top in Euro

How to pick tops IN currencies With Fakeout Bars

Euro Reversal Chart


Hi, It has been quite a while since I have explained the technical portion of How I Pick short to medium term reversals with relation to Background.

Today I picked up a classic Euro reversal chart, Although I pick that chart up yesterday for entry but I was waiting for strong rallies through demand levels as It already happened once but today was the day for me to enjoy the free falling Euro.
As a trader one must show patience to this type of scenarios as there is always short covering in strong downtrends and Once you saw new trend maturing then You must raise your hands and have enough experience to pick your part of profits.

Picking up tops and bottoms rely totally on what background and prior price action telling you and what are crucial levels and How price behaves at those levels as Most of the strong moves faded out quickly if trend is about to resume and ignore those moves quickly.

I never favor going short at top and long at bottom untill I see few failures in the trend prior to recent Price Action. But If you can't buy low and sell high and always wait for a pullback then You must think again what are the chances that you get good risk reward and How you can increase your profit factor, Even If you are making money consistently.

Euro is the most traded currency throughout the world and all the banks have reserves to buy and get a chance to sell at higher prices and supply and demand just give you hint when they looking to sell.

Dollar enjoy the ride against all G10 Currencies today, It often happens with strong trends as we just need a glimpse of triggering and Euro pause was also strong clue that market is expecting too much out of Economic data which did not met the expectations and hence price reverses.

With strong hints of matured trends(one must go through the blog to see How to trade mature trends) we must wait for this type of day when lot of bank officials are due to speak and present their views on economies and give us hints of the things to come in the coming weeks or months as It often resume the earlier strong trends or give us a strong opportunity to trade pullbacks at higher or low prices.

Institutions and banks always obliged and triggered as they always look to sell when they don't see things improving in coming days and that is why avoiding lot of indicators can give you exact entry price as they often react late when trend is finished and has very little to offer and that is why I always look to react at importnat levels.

Eur/usd and usd/chf Update Strong Correlation

Hi Traders,
Its Quite a while since I have updated the blog after the Aud/jpy which was faded away by several attempts.

I have spotted the activity in Euro and Swiss Franc which are strongly correlated and it can be seen in charts of both the pairs.


Eur/usd chart Strong Breaks with Strong Engulfing pattern 


Correlation In Forex


Its quite visible that both of charts are quite similar and the activity in the both charts means that strong money is buying and selling them in the opposite directions and we need to find out area which can give us maximal reward after strong sideways movement .

I would recommend to take one entry and not use both because this will double your loss but if you still can manage both with the tight stop then strong movement can be spotted in both of them as origin is still quite far away from current levels.

Sunday, May 17, 2015

Aud/jpy Update Room for Trends is still there

Intraday trading supply and demand strategy  


As We have seen so many time Sellers pick up the trends and do tend to pick profits at crucial levels and then price is often continue to spike up till it found conditions to reverse

Chart of Aud/jpy is making same efforts after clearing strong supply areas and now testing them silently to test If there is enough demand for the price to continue its way up.

 I would really be watching this pair closely as more than potential trade is on the cards if Bulls attack this breakout level again. There is no clean demand but there still need to evade the supply it has.


Popular Posts