Thursday, July 10, 2014

Gold Intraday Technical update Rise from strong Demand Area

Protection area in technical analysis when there is a breakout

Gold "Rise from Strong Demand Areas" And When we see movement that is going to be highly volatile and starting from inside of the trading range, it’s probably a «cascading effect» - something that is created by «fear of missing out» - many traders are chasing this movement and will lead to fast auction, raising prices higher and higher. In auction market theory it’s called "initiative break", it means that something is happening very quickly, with significant expansion in volatility, and maybe – volumes. But volumes can be not interpreted easily in this case.

When volume is increasing (or decreasing) inside of the trading range, this information can be misleading, because there are too many types of traders participating inside of the trading range – from algos to scalpers, and increased volume can be a result of those guys’ Overtrading

Gold Intraday Update as it has In strong run since low

gbp/usd technical update,Intraday updates, gbp using outlook still bullish, buy on dips.

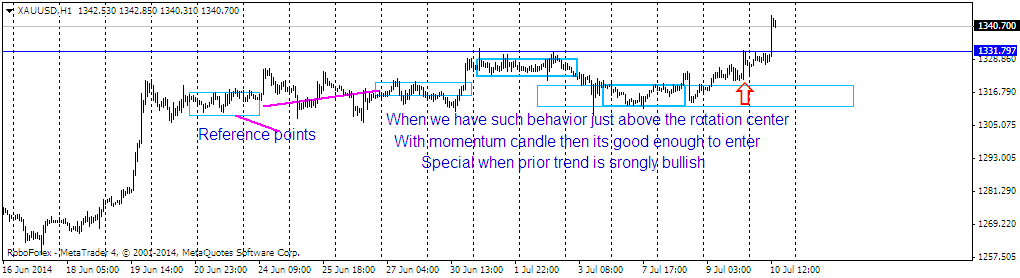
Gold Intraday Update Cascading Effect

The idea of posting such is good from Educational point of view and also such activities can get more out of you as a traders because It does make sense to trade logic things and trade what we see rather than what we expect.

Analyzing too many chart at a Time does necessarily means that you are trying to force the issues and try to capture every possible opportunity that can arrive at any time.

But things are different with "Commodities" traders that you don't have to be worried about anything else as there are two or three precious metal to remain focus as compare to "Scan" Multiple "Currencies", Which is impossible.

Wednesday, July 09, 2014

Supply hit the market Update Australian dollar

Supply has the market in Australian dollar

AS I mentioned yesterday that we have got another trade location in Australian dollar around 0.9405 Area and that was strong "Violation of rotation center" After "Accumulation", Entry was offered around 0.9410 and I was looking to take my profit around 0.9440-50 area, And After the release of "Australian Employment Report", which was mixed with Unemployment rate rise after decent People were Employed and Market was all set to test the Supply and that area was good enough for us to book the profit as price come back to opening levels of the day.

Updated chart of Australian Dollar

Australian dollar update, Release of Employment report of Australian, Price hit the supply in cross Aud/usd , Chance of reversals in Australian dollar, Technical Updates of Australian dollar , Forex update of Majors

According to my Analysis I always look to find pairs which are trending and have logic to reach or test certain supply demand zone as Price already priced up to behave in such manner.

That is the reason I never look for reversals too early Untill there is clear evidence that trend is mature and look to reverse or correct the earlier trend.

But Australian dollar has spend so much time near the highs, this and got rejected at the trend extremes It will probably correct deeper or reverse, So Now I have maintain my neutral Bias on the pair untill Price take the Highs with conviction and convince me to enter again.

Reason and Logic of trading supply and demand

Logical trading and Importance of context

As I have always mentioned in my previous posts that When you trade Forex currencies then there is strong conviction should be seen in your trades and Most important one in "technical analysis" is trade with logic. "Supply and demand" works together in forex market as there is strong demand coming out on previous reference points and specially when that area is protected.

Few days back I mention that I am long Australian dollar and I have few reasons for that Please check my previous post of Australian dollar here

Check the updated chart of Australian Dollar

Price has reacted the same way as I have mentioned in my earlier post,as that Particular area was strong "Confluence" and price holds the higher prices after breakout as well .

When you have such scenarios, then price usually Gravitates to test the high or the supply areas(In strong or elongated trends), as It has done in that case. Strong selling followed by "accumulation", always tells us the reason why the price has paused and start going sideways and that should be good enough to give us second thought before we go short in such cases.

Specially If there is a breakout and traders often trapped by strong selling and start selling the rallies but logical trading tells you to wait and see before fading such breakouts And If demand level is already protected, then we should trade rotation center violations of false breakout after the daily range breakout to the opposite side.(Also Known as Responsive Breaks)

It is important that you know you strengths and weakness.

Important to know your strengths and weakness

Have you thought about this thing – do you consciously understand what is your best niche in trading?

We are all different people. We process information in different ways. The only way to sustain ongoing learning process is to find trading niche that suits your personality.

They say – talent is the key for success. I would say – the key to success is «talent + environment».

To become master trader, you need to process huge amount of information, master all nuances and details of price action before you obtain intuitive skills. This is hard work, but it absolutely doesn’t feel like work if you’re doing something interesting and emotionally rewarding. This occurs when your natural abilities to process information are involved. Our learning curve accelerates significantly if we are operating inside our niche.

I will share with you small check-list that will help you better understand what your trading niche is.

Consider answering simple questions

Do I make tend to make decisions by analyzing data or by «gut feel»?

It’s not even about decision making process in trading, it’s about life in whole. For example, how you decide – what car or computer to purchase? Do you patiently explore feedback from some special internet resources? Or you just follow your impulse and pick what you «feel» is good?

It’s nothing wrong about that. This is how we process information and each of us has dominating style of perception as well as reaction to outside information.

In trading, «gut feelers» will be better at pattern recognition. Price action trading is not a science - from time to time, market creates short-term imbalances and elusive opportunities that can’t be recognized by traditional technical analysis – there’s no way to measure «aggressiveness» of the market or «lack of conviction». Yet people with strong gut feel and intuition can read price action quite effectively. Their learning curve accelerates when they start master some patterns and setups observing nuances and details of limited number of setups.

You can hear from this type of trader: «Here market is strong, here market is weak» - that’s how they view things, they will not be able to explain it. «It’s just obvious» - you will hear from them, after you will ask them to explain their best trades.

Other traders will need research and solid rationale beyond their trading decisions. They will be more capable to deal with building trading systems, measuring and optimizing parameters, dealing with statistics and so on.

For example, I tend to be more «gut feeler» (though I have solid trading approach, once (several years ago) I was trying to master some «mechanical trading systems» under supervision of experienced trader. It was a complete disaster, I’ve done a lot of mistakes, was emotionally sucked out and lost significant amount of money.

It was tough lesson for me – I had to switch back to my preferred trading style and master it. Then, things have become fine.

Tuesday, July 08, 2014

Are candlestick alone reliable for pullback entries ?

How candlesticks patterns trap traders

How Candlesticks trap traders,Why candlesticks alone are not reliable, Candlesticks Trap action, Candlesticks don't help in long term

Trader relaize Length of Candles were not big enough

Why I always think that candlesticks are the least important things in considering pattern outlook. I have heard from lot of newbies and experienced traders that candlesticks "Price action" is the best way to trade, But for me it has the least important factor in determining the trend outlook.

When traders saw strong Momentum against the trend,Then traders quickly start observing that it is the end of the trend and Price is reversing, But smart money never react that way, they rely on liquidation to reverse the trend, or to continue as they always try to accumulate their orders and always look to buy low again and stat building on their position slowly.

Same thing has happened in bearish reversals as they always give you better low price to enter and Traders realize that we are getting another chance to buy the Inventory at low prices, And bang they sell with even more forces and that is what has happened in the chart mentioned above.

Monday, July 07, 2014

Australian dollar another demand level could be eyed

Another opportunity might be on the cards for Australian dollar

I have taken a closer look on the cross last weekend, and waiting for demand level in Australian Dollar which could be eyed by Strong buyers, But the reason I am not too much eager about the setup is that due to strong selling pressure from multi month high.

But as I have mentioned I always look for setups that give clear indication of continuation and In this pair there is one on the cards offering pullback.

In the chart, I have seen some strong reference points which holds the highs and higher highs were posted and strong liquidation which has not yet picked up momentum,but it could be a part of extended accumulation. Strong points are :-

1. Price has strong protection area mentioned by blue line

2. Price close the week on lows at demand area

3. Price holding the demand level after strong selling which could be a part of strong accumulation.

Take a look at the chart below

All the traders who trade technicals and contribute a lot and achieved a lot and have confidence that setup has strong logic and reason to enter and exit. And same thing has happened here for me, as there is no strong supply but a little one around 0.9440-50 area which was previous top and stops could be place around 0.9330 in case any whispaw that will protect the entry .

Friday, July 04, 2014

Gbp/chf Breaks the equilbrium and momentum was again shifted

Trade what you see don't what you expect gbp/chf technical update,Intraday updates, final auction strong technical reason outlook still bullish, buy on dips.

gbp/chf strong push to the upside after strong consolidation Intraday update

For those who did not see my earlier post take a look at here

First thing we do when we see a chart is to see what is the main trend, and when we have some strong background not too historic one but has happened just recently, and price start moving in the direction of the main, we start observing that whether or not the resistance o support will hold.

But when we see that type of chart where swing from low is strong and corrections are getting smaller, then we should wait for the final push and test and that is what happened in the cross and I was first to point out that franc weakness against strong pound is imminent and my doubt became more evident when price break the 18 months extreme and weekly and daily extreme on hourly chart.

Most important thing we do before we pick any particular chart is that what is the main trend and whether or not imbalance is still present in the market and the answer is yes, Imabalance is still present in the market .

When we see strong swing and price behave with low tempo when it start correcting then we need to just pick that type of chart and start looking for trade locations which was offered with the strong push through previous "consolidation range", and then price test and then spike was so strong it gone through all the barriers and in no time it climbed up more than hundred pips.

Are we seeing continuation of downtrend in Euro !

Trend continuation after correctional bottom.

Are we seeing "Trend continuation to the downside Rally", Are we really seeing another attempt to downside for the Euro, And if I am correct, Then soon we will see the test of correctional bottom.

Downtrend continuation confirmation, rising attempts have been failed

The idea I post earlier was that We have seen rapid liquidation after strong trend which means at-least one attempt to test the high and Very often price gravitates to the upside.

when we see such attempts, But all the attempts have been faded out and Now we will soon see another low in the trend.

In order to invalidate this Rally, we will have to break above 1.3695 and see an attempt to rise once again. But current rally and attempt to rise have been failed so far and the outcome is test of lows and possibly new low.

Thursday, July 03, 2014

How much importance does context have In GOld Rally

Gold weak buyers breakout or correction

Gold rally from lows is very strong and It has stalled and spent so much time near these areas, In order to point that strong holders are in dominance one should look to spent time near highs but breakout and shift in momenutum has nothing to do this time.

May be strong holders left the rally around this areas and recent breakout has been done by weak or small position traders and IF that is correct, we should soon see strong liquidation today or days to come.

I would bet on that sell-off today because of lot of high Impact News, First ECB rate decision and then "Non Farm Payrolls".

In the chart below I have pointed whether the recent breakout has been hold by "Strong holders", and if that the case they won't let sellers to get hold and will keep moving the price higher immediately after the Momentum fades out by price again breaking below the upper boundary of "Blue rectangle".

False breakouts, reversals pattern, logical trading, reading overall context in gold chart

Gold Chart Possible false breakout followed by reversal

Simple rules when price spent so much time near highs then it works as double edge swords that whether strong holders are no longer interested, then it is overtaken by small holders and they continue to buy on dips and make a breakout but then immediately strong holders make their presence and create massive liquidation and that could be the case here as well in Gold chart.

Wednesday, July 02, 2014

Support resistance Trade Locations and Then Final Auction

Final Auctions always do tend to move the value higher immmediately

As clear from title, I am talking about "Support resistance" (short term barriers as there are no terms associated with S/R In my trading)"Trade Locations" and "Final Auctions". These Terms are know to every Forex trader but How Important role they play in developing a successful trading career.

Nobody knows this answer, As these terms are incomplete without each other and When you trade any strong supply and demand market you will have to take them all together and then think about making consistent money.

I mean to say when a trend is maintained throughout and became an elongated trend and you find some sideways movement and then downside take momentum but it is faded out immediately, That means that imbalance is still there in the market and It will offer entry at good price.

Take a look at the follow chart of gbp/chf

Pair is in strong elongated trend, amid strong "Great Britain Pound" Across the board.

 market break all the barriers, strong push to the upside after consolidation, chances of price to resume its trend shortly

gbp/chf FInal push Break the equilibrium and all the barriers.

AS I have stated in my posts, there are strong convictions that when you approach that type of trading methods , the chances are that you might fail to understand the momentum when it hits the market, But the truth fact is that trend is often part of imbalance and till the time, price does not break the floor with strong downside candles, the chances are very big that trend will continue after "accumulation" end and distribution phase started.

Tuesday, July 01, 2014

New Updates based on recent price activity.

Technical updates

I have scanned the market activity of recent week (as I never rely on price action too historic) And I have seen some missed and some good opportunities.

Trends often occur when there are not enough traders involved and market has to advertise more and more to attract liquidity. So, big market participants are often not interested in trends, they would rather prefer balanced state of market to have opportunity to slowly accumulate their positions. It’s tough job – to accumulate position on the rising market.

But as we have seen most of the time they accumulate the price before finally advertising it higher, and gbp/cad recent example I have sighted on the chart and Entry and exit are mentioned on the charts given below

Take a look at update chart, Bit complicate to understand but not for those who have regularly visit my blog for updates

Trading conviction, real time forex trading updates, Gbp crosses in strong momentum and outlook is still strongly bullish

There is strong trade location building, which tells us that another spike and trading opportunity can arrive anytime soon, and We should not use higher stops to trade that opportunity and that is what smaller risk and strong rewards is known for.

Monday, June 30, 2014

Concept of Final Auction

Concept of Final Auction

Take a look at the updated chart of gbp/usd

I mention in my Friday posts that strong bias is building up in the cross, and stops are placed at 1.7003 area, price went to test the stops but spike two pips away from the protection area, and finally breaks the equilibrium barrier, and reached 1.7150 in no time.

Here is the updated chart of Sterling

Sterling on new multi-year highs,breaking point of equlibrium, technical update strong bullish momentum

gbp/usd New money flows.

Here We have seen the strong violation of rotation center, where price spend a neutral days and tells us that that breakout from 1.6972 to high of 1.7040 was the activity of strong buyers and give us hint, that they took the stops both way before marking the price up and usually not every level of price is important for market, But the levels which are important for market, they will protect those areas and strong reason to accept when price broke the psychological barrier of 1.7050 with ease.

Now, that price rallied to new multi year high, exposing another opportunity to see if new fund inflows to get it through 1.7200 barrier.

Saturday, June 28, 2014

Value Shifts Immediately higher for Final Auction

Shift In Value, Market Breaks the point of equilibrium Let’s first think about this: every trader has his idea of value, some traders recognize it, some don’t, but we all have idea of value, if we haven’t had it, we would not be able to make a trade. If you go short, you should think that current prices are unfair and market will return to lower prices, if you go long, you also should be aware that value will be built somewhere higher than current price levels. If you sit on your hands, you should think that value is located somewhere near current prices – in other words, opportunity hasn’t appeared yet.

Conventional and straightforward way for capturing value is to build moving average and derivative of moving average – Bollinger-Bands indicator. Moving average is considered to represent value, borders of Bollinger Bands are considered to represent 1 standard deviation from average:

if we take moving average as a substitute for value, we are risking to get many misleading signals.

Why?

It occurs because of what I call «Inequality principle»

It claims: «Different price levels are not equally important for the market».

Do you feel what I’m talking about? Moving average can’t distinguish what price levels are more important for the market – it’s responsibility of a trader. Missing piece is market logic.

But period in the red circle was a final auction, overall trend was rising and market was no longer able to stay inside of a trading range. When market lacks selling liquidity, when nobody is going to sell, it start advertising higher searching for sellers.

We often see that price is leaning to higher extremes and holds on higher prices.

Friday, June 27, 2014

Concepts of Protection Area


Protection area in technical analysis when there is a breakout

I have mentioned the concept of "Protection Area", As there are so many traders wonders that whether a particular breakout will succeed or will faded away, In this extended post I would like to mention the concept of "Imbalance" and "protection area", in one example. Price built up momentum early and when there are market run away from those prices, then market reject the prices from level below and that is why there are strong chances, that those areas are protected by Intra-day traders.

As, In any cases it become difficult to look for entry specially when price went back and forth on a neutral day after breakouts, so I always look for rejection point rather than momentum candles, Because momentum candles do carry wider stops, but rejection candles really don't have to risk too much and reward is always "hotspot area" or upper boundary of price action.

Gbp/usd technical update with low risk reward entry

gbp/usd protection area Intraday update

IN this chart, I have cleared most of the doubts that happens to be in mind of an intra-day trader,with above mentioned example as there price was protecting levels and then we saw strong momentum coming off from that area and we had to use wider stops but then we have rejection candles off that 1.7003 (Low was 1.7005) as the entry came in at 1.7019 and the risk was 16 pips and that risk was covered with the reward at the end of the day which was 19-20 pips.

As a technical trader, we should look to wind up the positions at the weekend and look to enter at the start of the week again if price offers such entry levels again.

Tuesday, June 24, 2014

Elongated Candles Rotations center

I have discussed a lot about "elongated candles" which forms a "rotation center" as and protect any rally against these candles and forms a rotation area, Price squeeze to test the high or low again and sometime go beyond the extremes. I would put more light to that topic soon and cover some trades as there is lot of strong trend which has been pause for quite a while and market preparing for next moves possibly reversals. But it is quite optimistic to predict it too early but recent candles in Pound chart, hinting it could test the strong support.

Will post a chart soon If I found something lethal in the days to come and cover this topic with strong examples.

As Promised, here is gold chart updated with possible outcomes

This chart is a prime example of "Elongated candles often works as vaccum in the market, and As we have seen some good strong bullish candles at support which 61.8% of Fibonacci ratio, which wave traders used for wave ii or wave iv correction, was a clear trap and price fall rapidly.

But in such case when price end the month on lows and after such behavior If you see any consolidation (As in case of Euro Recently) you should wait for price to rise to sell rallies rather than just selling with the breakouts as such breakouts often offers good low price buying and test of high of consolidation area or high of the swing, so we would wait for any confirmation in such case to sell the rally specially when we see patterns that don't followed by follow throughs to sell the rallies, Will update the blog if found some substantial.

Sunday, June 22, 2014

Australian dollar updates Rally Across the Board


Australian dollar bullish momentum continues

For those , who did not check my earlier chart, Check my previous post here !

As I mentioned in the previous posts, rally of Australian dollar across the board is most expected, and little correction and another shift in momentum is seen, And this time it is with even more force.

If you see the current rally from the lows, then it has bounced from 0.9320 areas which was mentioned as extreme support and now again after ending the week on lows, price accumulates enough, and today there is rotation center violation which is good enough for us to reenter

After price open up with the gap to the downside and then a little upside rally after opening, which was not very strong but you can see "Shift in value" on hourly chart and then spike after the release of Chinese manufacturing PMI which tells us that there was a strong improvement as PMI has crossed the level of 50.0 and above 50 there is strong improvement after months below the 50.0 Mark.

So, there is always a mixture of fundamentals and technicals, which make us flexible trader, because alone technicals are not helpful fundamentals has to be supportive in every course, to support the rallies, and Price if breaks the highs with force, then there is strong test of 0.9510 area could be seen, and after that 0.9570 and 0.9630 aera.

I would always support risky asset class as Crisis situations as war in Iraq is picking up and this force Institutions to buy Gold and Riskier asset class like austrlaian, canadian and newzealand dollar, which always works as safe heaven in risky events

As we have earlier seen, buying of canadian dollar last Friday, So, it could be turn of Austrlaian dollar as well.

Wednesday, June 18, 2014


Upate on Australian Dollar as Rise was on the cards
Australian dollar outlook still bullish

Those who did not check my earlier post check it here

Price did exactly what I had earlier anticipated, and I have covered my position due to close of trading session and daily activity and I would like to see a retest of the zone of entry as I have mentioned on the chart.

We do need strong rallies after test in the pair to reenter. So, Nice daily profits as It was targeted earlier with "reference points" did hint us.

Tuesday, June 17, 2014

Australian dollar Intrady technical levels

In my earlier posts, I always mentioned that we should look to find "Imbalance" to spot the "Institutional activity" in strong trends and shift in value can provide you with another attempts to test the high, specially when trend is strong enough to keep moving back and forth.

As I have mentioned in my previous post that "Australian dollar" is about to break the barrier and it did hold on once again and I was stopped out, and once I was +50(greed to earn more) and I had to cover and stopped out at breakeven and Price has rallied from that area and looking to test the previous zone which could be protected by "Strong holders" which is 0.9210 area.

If it holds and price try to accumulate then there is strong chance of momentum carries the price to test the highs, and In strong trends it is strong possibility that price "Gravitates" towards the previous "reference points".

Price action building strong trade location here

Imbalance still there

There is a strong chance that price will go through the support zone, but we should look out for with the trend possibility and when you are trading with convictions you should look to back your strengths, and My strength is I never look for reversal too early until there is strong liquidation and couple of attempts have failed.

I also look for candlesticks congestion areas or bullish liquidation traps as there was one yesterday, and price reversal today offered an opportunity but I am not too quick to launch on such scenarios.

Intraday trades UPdates

usd/Chf Intraday update

Posting a little update on the usd/chf chart possible congestion candle the last bullish candle and the trade was triggered at 0.8980 and I had to covered the trade around 0.9000 because of slow tempo.

Still there is lot of room but I would like to remain on sidelines ahead of FMOC statement tomorrow and anything can happen but if Fed tap more then we should see rally in usd bulls.

The idea was right look for momentum to carry forward the last day momentum to atleast test the highs and I expected that but due to lack of volitality, the pair seems to pause at the resistance 0.9010

Take a look at the Updated usd/chf chart

I would like to re-enter again if I am given the opportunity to buy low again, but that could seems unlikely because if an area is built then there is unlikely that price visit the previous area.

But to facilitate or through liquidation break it can happen but chances are very rare. Uncertainty drives the market and if price breaks the recent barrier and take out the highs with momentum, then there is strong chance that the trend resume and test multi month high at 0.9110 area and break of 0.9030 will offer good risk to reward.

Monday, June 16, 2014

Extreme support levels In Current Major Currencies

usd/Chf Intraday update

Currently the price action is sideways, may be waiting for Fed to taper more this wednesday, but Our work is not be too much complacent with what would happen will drive the price for surety, as Eur rate cut was welcomed by market and euro found support around 1.3500 area.

But for me I never try to predict what is going to happen or not. I always look around for the pairs which are trending and the reason they go sideways or trend is paused needs confirmation or even if fundamentals does opposite, they do tend to find support to really again .

And that is why I have put a lot of thoughts in to usd/chf chart which has told me that recent rally from the lows could be a hint of big buyers and support zone is strong around 0.8956 and 0.8910 area but I would expect later to protect any strong downside rally, But we need to trade momentum from the located areas on the chart and I would looking to add more to my recent longs around that area again

Take a look at the usdchf update chart . Are we looking at culmination ?

In this chart there is stair stepping trend, which is followed by moving market accumulation and then pair has found support on similar levels it did before, And pending rally still looking for momentum and this could be a start of culmination which means there could be a start of strong trend and we need to keep look to buy on dips, if and When we are offered any such opportunity.

Saturday, June 14, 2014

Price action basic recent update when there was no supply

Minor development areas base after breakout know as protection areas

I have covered most part of these blog with "simple price action when there breakouts followed by neutral day minor developments and has no supply to hold the price to that level", which means that if we see some area is protected by the market strong holders then any spike and downside rally is always strongly protected by those areas.

In the following chart I have covered a scenario (the most recent one), where you could tell yourself who is moving the market or who has the control on the price action next move

If you dig deeper than simply following price action, you will understand that supply and demand will drive the market. But supply can be short-term, then transform into demand and vice-e-versa.

So, you have to rely on professional supply and professional demand and be able to distinguish it between other fluctuations.

Recent price action makes it clear where is ongoing demand

Price action basics,No supply area and minor development areas with protection, rotation areas,Ongoing demand of currency

Check this post how reference points works to find good trade locations

Charts often tells you what to do and to trade what you see, but when we relying on other things like candlesticks patterns or any other trading techniques we relying on them rather than we really on what chart trying to tell us and that is what basics of price action pure basics are.

When market breakout from a level (Strong accumulation breakouts or range breakouts) and maintain a level above and we strong neutral day and minor development area and then market end the days on lows, then we have to see if there minor protection and development area and look to see the market reaction when price touch that development area again.

In the above chart of nzd/jpy strong trade location were there as there was minor consolidation areas were at the top and market really had no supply below to hold the prices there and the result was followed by strong demand.

Candlesticks patterns are reliable and work most of them as congestion

Candlesticks patterns in overall price action patterns

I see that many traders create complicated approaches to trading, so I've decided to share with you some simple candlestick patterns that you can use in your trading. But I must warn you that patterns itself are not enough to generate consistent profit.

You will easily find conflicting patterns on the same price chart – one signal to the «long» side, one signal to the «short» side. You have to choose between those signals – which would you accept?

So, patterns are not enough. You should sort of «big picture view». You should have idea of where the market is traded right now. I say – «idea», it’s not really «knowledge».

Every view we have is considered to be an idea that we have to test – sometimes our ideas are good, sometimes not, but if we build our ideas basing on something that works, we increase our odds of success.

Also, it’s more effective to use those patterns on time-frames starting from H4 and more. The lower your time-frame, the more noise you will have and the less importance candlestick formations have.

By «candlestick formations» I mean something not too complicated. All those «Morning stars», «3 white soldiers» and other conventional candlestick formations create more complexity and push us to predict price action rather than to trade upon what we see.

Congestion area often give traps or continuation hints

1. Congestion. Most of the time market holds in congestion. It is a price formation, that is built like shown below. We have measuring bar (candlestick), usually it’s a candlestick with elongated body. High and low of measuring bar become local support and resistance level.

Also we have at least 4 candlesticks that don’t violate or at least touch high and low of a measuring bar. Duration of average congestion – about 10 bars/candlesticks.

If we register that market is traded within congestion, all trading signals will be of low importance. Price movements within trading ranges can be a result of random move. Nobody really knows what do they indicate.

Also, price will tend to find local reversal points within borders of congestion.

2. Simple continuation pattern. If you see that price action emerges from congestion or some trading range (and you back up this pattern by understanding that main trend is headed in the same direction), you can use as simple pattern as shown below.

First you identify directional bar/candlestick that is considered to have small or no tail at the upper side (for bullish pattern) or at the lower side (for bearish pattern).

Then you simple can divide this candlestick on 4 parts and place your buy limit order at the upper quarter (for bullish pattern) or at the lower quarter (for bearish pattern). Your stop-loss should be set with respect to volatility (say, ATR indicator) Let me know if this topic is interesting – should we continue talking about that?

Thursday, June 12, 2014

Strong signs of Paradigm Shifts

Intraday forex trading opportunities

As, I mentioned in the last part of my trade updates about Australian dollar can continue the rally, and It give me confidence after decline in unemployment in OZ area still giving boost to Australian dollar and Longs were triggered around.

Australian dollar can break through any time

The best part of this activity is that liquidation break has been faded out and price has taken the highs out and Now just consolidation and holding higher prices, which is also a good clue if it is followed by a test of trade location during the release yesterday.

If you want to get good price and capture a reversal of correctional trend(as you can see price spike off minor development area from the lows which is mentioned in blue rectangle), you should seen signs of real support. Real support creates conditions for a reversal if market goes against big buyer, as I mentioned when big buyers are holding the prices at highs and create trade locations and then we see strong selling as market goes against them in this case. (remember –to reverse the market, there should be supply/demand imbalance).

Reversal occurs after paradigm shift, when it becomes clear for most short sellers that they were biased and go in the wrong direction.

In such case, we most often see imbalance in price action, when market has already create a development area and end the day on lows, then next day or two we saw strong accumulation and rejection from the prior day low, the suddenly paradigm shift and strong continuation of the trend is seen.

Tuesday, June 10, 2014

Reference points involvement in predicting next possible move

I have covered "reference points" in my previous post in which I mentioned how we can "pick reference point in predicting the next possible move", as there is always a chance of neutral activities after breakouts, which prevent the strong rallies to the downside.

I posted a chart of usd/chf chart on Friday for possible continuation to test the highs after we have some good trade location taking out the "highs".

The chart below is a true indication of institutional activity and when we have some good reference points after breakouts, then strong downside rallies are often "reversed" as In this case.

Recent price action update of usd/chf chart !

Although it is not necessary that we should look for this kind of price action in every strong breakouts because it tends to gravitate to the upside after the end of correction, But the chart which I mentioned above accumulate after that downside rally and strong breakout test was there and that rally pause to take the stops of buyers.

But the important thing is next rally was powerfully to give you second entry and trade location was exactly the low of correction that start from low of bottom.

I have seen some strong buyer is Australian dollar as well will post the chart soon If I got something substantial

Monday, June 09, 2014

Basic convictions of technical analysis

Convictions of Technical analyzing in depth «Price reflects all, trends will likely continue and history repeats itself.»

I would say, it’s true in the first part – price reflects it all, what about 2 other? Will trends continue and will history repeat itself? It’s a big question because nobody knows what «trend» is for example.

Some people draw «trend lines», but more often than not they provide information that is already useless. Trend line shows trend when it is already confirmed, therefore it has lower odds for continuation.

Traders also use support and resistance, but it works only when strong demand or supply drives the market. Those technical methods will not help you identify strong supply and demand – the fact that price has touched some level twice is not the indication of strong demand.

But what is that?

Einstein once said that you can’t solve the problem using mindset that created this problem. To combine information that price gives us, we should apply one more parameter, and this parameter is time.

Of course you are using it in some ways, but traders often don’t use in consciously.

What time gives us?

Time is one of components of value. The more time we have, the more value we can create. Simple example is interest rate. If you put some money in the bank, interest rate multiplied by time will increase your capital.

The same is in trading. The more time market spends near some given level, the more this level is validated.

There are some clues when you employ parameter of time compared to parameter of price.

Corrections are not deep enough.

On screenshot below you see no spikes on the way down:

Trend is likely strong if:

Usually they don’t exceed 25% of previous move up.

It means that strong buyers are probably dominating. To make things clear – by strong buyers I mean «buyers with distant stops», not «buyers with unlimited pockets». But more often than not those who can move the market and yet have distant stops are huge enough, be sure about that.

Why does it work that way? If you see weak buyers involved, they would liquidate quickly and market will go after their stops – you will see rapid «spikes» on the way down.

I will cover more on this topic in the days to come ! Keep Checking for Updates

Thursday, June 05, 2014

Types of Swing trading.

Swing trading and its types update

What is swing trading? How "swing trading" differs from «momentum trading»? Actually, there are many approaches to swing trading, but I will express my point of view on the subject.

Swing trading is trading on intervals more than 1-3 days, some traders may call it «long term» or «medium term», but in fact, good swing trade can last no more than 4-5 days. Swing trades are usually level-based trades.

For example, if you trade momentum, you can capture short-term overbought or oversold condition of the market (imbalance) and trade-off scenario of inventory correction.

Swing trading basic based on rejections and hotspots areas

I basically trade 2 types of swing trades – «rejection trades» and «hot spot trades»

How do they look like?

In this post I will talk about "rejection trades".

Briefly, rejection is a reversal. It’s that simple. But there’s one small nuance. Rejection level is not a «support» or «resistance» level. Actually, there are no support and resistance levels – there are only areas of support and resistance. And they are usually located where majority of traders don’t seek them.

Important principle:

Before ever considering fading correctional move, you should see signs of support/resistance before. Sun Tzu had said: «Every battle is won before it’s ever fought»

The same is in trading. Every reversal is made before it’s occurred. Weird, huh?

Reversal is just a paradigm shift in heads of market participants. Before reversal, market must have strong imbalance between demand and supply, otherwise no power can drive the market against existing trend (even correctional)

So, to decide whether to join a trend or not, you should see signs of big money buyer (seller). As you know, institutional buyer will tend to accumulate, to slowly build his position. More often than not those guys are not speculators in conventional way – they accumulate position by given price, then use purchased asset in business outside the market.

So, if you see that market tends to show you very well traded levels in the center of the day and poorly traded levels on the extremes of the day, it can be a sign of accumulation if this process goes long enough.

Look at the chart of usd/chf – you have seen signs of big buyer accumulating long here – look how price is leaning to the area 0.8970. How do you think – why market shows strange consensus around this level?

Also, you expect to see «neutral» or «normal» days as the process of accumulation goes on. Neutral day is day with very low tempo and aggressiveness – it closes near its open. Normal day is more aggressive day, yet it also closes near its open. These days also help you find accumulation areas on the chart

Usd/chf update

Here is the update

New Usd/chf chart update

As I mention earlier in my post, sometimes it is easy to find reference points rather than mere support and resistance and current rally is a example of that and Price was willing to rally after strong consolidation for days and that is where we should stay alert.

Are we seeing another attempt before ECB decision

usd/chf Intraday update

USD/CHF Intra-day Technical update . Are we seeing another rally

There are some things that mostly day-traders do and rarely (if not never) other time-frame traders do. As an example - reaction on short-term reference points.

Price action indicates - what market does right now, but we need to know not only that, but - what to expect from the market? What can we anticipate?


While we analyze any chart, we first rely on the recent price action and rely on reference points, which are short term location where price lean after break out, Candlesticks chart or support and resistance traps are quite often ( I don't think that there are any such strong and resistance area as there are extremes and rejection areas and it is important for us to know how market react after breakouts)

With candlesticks, I don't trust any patterns as there are often strong breakouts are followed by reversals,Big buyers used Candlesticks against the strong trend to reverse the price for liquidation purpose and to trap the traders who don't know what is "Context" and what market tells you to do after such a candle appears and price did not follow through or pause for few sessions.

Monday, June 02, 2014

usd/jpy strong accumulation period after breakout


usd/jpy Intraday update

usd/jpy Intraday update . Are we looking at culmination ?

The reason I was concerned with this trade, because there are not too many times price has lean near those high prices and downside price action was rejecting from low prices.

To spot «weak holders» activity, let’s think – what levels will be not interesting for big money buyers/sellers?

They are – sessional highs/lows, previous days highs/lows.

We see some participation from level above and price freezes near level below. If it reverses from this point, probably it will be a sign of day-traders purchasing there.

Big money players are not interested in that levels – they don’t attract enough volume for them(Like the one I mentioned where are set my stops), Big money buyer will rather act inside of consolidation, because he needs volume to execute his position. (They rarely react at daily price extremes) Now if you have two attempts from day-traders to play long and to play short, you may want to see – what group is going to earn money.

If sellers will have good prices to exit (prices will breakout to the downside quickly), then probably market is driven more by strong (professional) supply there, if day-trading buyers will win, then some strong (professional) demand is there and helps them.

Usd/chf real time update.


usd franc real time update based on Intraday chart !

As I mentioned in my previous posts that trading is advertising mechanism and we have seen this in the pair when Institutional money is continously buying at low levels, For those who did not follow my previous post check it here !

Price action does give us hints of buying

In this chart we have seen some strong trend breakouts and recent breakout we have two scenarios, One price after second breakout was holding higher prices and when we have few neutral activity days and if that strong holders, which it was, will test the low and shift in value and then they start buying again with even more force.

If Our assumption is correct price will break the barrier and will make a new high and that should not enough as we would start covering our position if we see any such activity.

Demand and supply are very crucial aspect of trading and when price is in strong swing it gives us an entry to renter at pullback but we must consider a thought that why such entry is offered, and any logic behind offering such entry.

When we have good solid background which tell us that buying activity was there even while correction and any such area which has hold before could be a good clue of price will advertise higher again and even with strong force that it was done earlier,

Tuesday, May 27, 2014

usd chf update basis on the recent price action


I have continously mentioned in my posts that we should look to find out "context" which is highly important in deciding the faith of a trader and the next predicted Move .

This type of trading give you an edge over other "mechanical systems" where the focus is totally shifted on any predetermined indicator's value.

The reason I have mentioned before putting an update is because pattern was repeated in "sterling" chart, I mentioned last time I update the blog. Sign of "strength" is always when we see "accumulation" at the lows and then we saw breakouts followed by protected levels.

but when we see continuous highs and and Price holding higher prices, the it is totally could be the case of "accumulation" on the moving markets and Friday we have seen buying at low levels as well.

Update of franc chart tells us another move could be strong

I have mentioned all the important factors in this chart, which could lead to strong moves and I have not mentioned any support because there is not a sign of strong liquiation and that is in itself a sign of extreme strength, but one should not see panic in the mind of traders otherwise that imbalance that has been created would disappear,

Little update on the chart as I discuss earlier , recent activity does tell us that price is still moving in the accumulation period and any strong selling here and momentum arrives again then we should fade that liquidation.

Check the update chart !

does candlesticks pattern is the only way to locate trades


Here, I would really feel sorry for those who look to relying on base candlesticks patterns to find trade location (even though they have importance but overall context is necessary).

Sometime we try trading those patterns with small stops in rangebound or trending markets but they have least importance while price is ranges.

There are two type of basic rules in trading when you trade and one of them is breakout and other one is fading the breakout and candlesticks patterns plays an important role which breakouts are there to trade and which one are to fade out.

Candlesticks charts are least important pattern in trend recognition

I have post a chart of pound where I have discussed all the important factor to how to trade a reversal . There are few points I have clear that even though prior accumulation and strength of trend was immense but it takes a day to reversal to happen and that is what we all needed to look out for such patterns for an Intraday trade.

We have few basic bullish engulfing patterns, one at the top of the chart and other one happened just today followed by strong selling.

Just take a look at the chart below !

Monday, May 26, 2014

Price can advertise higher without even testing the shift in value


I will discuss today how you can spot value in different cases, specially when we see strong breakout and price consolidates (accumulates) before. The important point to note is even price can still hold higher prices after values shifts and without revisiting the area

And when price revisits the area it can easily go beyond that location and create a false trap and start building the new accumulation area and then we see rapid moves to the direction it break out earlier.

spotting value is not easy for Intraday setups

It is not easy to spot any change in value but when we see some breakouts and price start building and spent most of the daily (80%) of daily activity at higher prices after change in vlaue and hold higher prices, then we need start thinking of the next step that strong or weak holders take, because if that breakout is done by weak holders than it will start liquidation immediately but if it the smart money who is making moves they will start building their position at value areas

Usdchf Update as discussed earlier on !


I have continously mentioned in my posts that we should look to find out "context" which is highly important in deciding the faith of a trader and the next predicted Move .

This type of trading give you an edge over other "mechanical systems" where the focus is totally shifted on any predetermined indicator's value.

The reason I have mentioned before putting an update is because pattern was repeated in "sterling" chart, I mentioned last time I update the blog. Sign of "strength" is always when we see "accumulation" at the lows and then we saw breakouts followed by protected levels.

but when we see continuous highs and and Price holding higher prices, the it is totally could be the case of "accumulation" on the moving markets and Friday we have seen buying at low levels as well.

Update of franc chart tells us another move could be strong

I have mentioned all the important factors in this chart, which could lead to strong moves and I have not mentioned any support because there is not a sign of strong liquiation and that is in itself a sign of extreme strength, but one should not see panic in the mind of traders otherwise that imbalance that has been created would disappear,

Little update on the chart as I discuss earlier , recent activity does tell us that price is still moving in the accumulation period and any strong selling here and momentum arrives again then we should fade that liquidation.

Check the update chart !

Friday, May 23, 2014

Comparison between two charts for Best of trade location


Here I would like to mention not only about how patterns repeat (not chart or any other technical patterns)

But real trade location which advertises trading opportunity specially in forex when demand overcome supply and vice-versa.

Take a look at the Chart of Great Britain Pound

I will update the usd/chf chart later on the day. Possible trade scenario for the next and if it goes right we can book some good profits

Nice weekend and Happy Memorial Day in Advance to all my followers

Thursday, May 22, 2014

usd/chf update Are they really buying at low levels.


Here I got a clue of Usd/chf buying at low levels

Take a look at the chart !

Trading is an art , not a science and don't need to win anybody's heart by looking for trade locations as it will remain within you and your confidence level.

If you always look out for such neutral activities after the strong breakouts and low tempo then don't make a mistake of trend reversal untill price break the floor.

Thursday, May 15, 2014

Usd/cad possible trade location is at the low correctional bottom

When we look for "context", then we should look at the recent price action and what it is trying to attempt , and that chart tells us that strong trend reversals has few points to consider and sideways action is totally good idea to short the rally or attempt to break and failures are the other ones.

Strong elongated candle from the lows and it was multi- month low and also it followed no trade location which could mean that smart people are looking to sell rallies in the pair.

But the area which is mentioned "Extreme Supply", in the chart is an area where we should look to buy the pair as this sideways action could be a part of accumulating the recent supply from lows. I am short on the pair but only time will tell and my stops are place at 1.0940 area

Price action is very difficult to read sometime but the logic of trading should be right and there should not too much inclusion of indicators or even so many views should be taken, because trading is an approach and till you are not able to accept your strong points and weak points, it become totally impossible to trade any market

All the filters should be checked (not all the indicators), such as market sentiment, profile and current demand for the subsequent pairs and then one should start trading the way market tells you to trade.

Brief Explanation of Price Action Correctional bottoms

When we see, correctional bottom in strong trend and liquidation is so heavy that price start "Gravitating" towards the high, and break above it but after that we saw some strong attempts with strong bullish candles, which faded away lately and break below the correction bottom and then another break found new low.

Price action suggest to short around 1.0910 area and it was good rally to the bottom but still we should look to sell rally till price is below the supply area.

Good luck, let see what happens with the pair !

Make or Break time for Newzealand dollar at multi-year Highs


Earlier, In My Blog posts I have discussed a lot about Possible "Trade-locations", which could be a Hot-spot area in a bracket, Multi-year highs, Intermediate false breakout, or a neutral activity after a strong breakout. First of all, the biggest example is eur/usd breakdown at multi-year high and the chart was posted and now I am looking for the same to happen in Nzd/usd.

Idea is to look for high probability trades, by this I don't mean to hedge the position if price price breakout that trade-location to the upside again.

When Trade location Inside a bracket

Price is in bracket still after false breakout of multi year high, which is a strong break above 0.8700 area, after that we have seen continuous decline on h4 and h1 chart which tells us about possible market has broken the floor and after the rejection candle we get today, which is strong bearish engulfing starting way high from yesterday's close and stops should be around 0.8680.

You can wait for possible more evidence or strong selling and the break of confluence and lows but as I have already spoken earlier, that always try to sell after upside breakout (beside "Context" tells you to do so)and buy after strong breakout to the downside specially when it is a responsive-activity.(By responsive activity I mean strong trend after breakout and then price goes sideways on neutral activity and break below the range of the day ) I have discussed all the "Breakouts" earlier on this blog.

Continuous efforts to rise and multiple rejections, then we saw narrow trading range which always give us strong hints, how price could behave and If our assumption is right, then probably it will be a start of larger move up or down. But as price is giving us hint that it could be a mature trend, as we have seen some strong momentum from the lows ( after breakout), certain rapid moves after intermediate false breakout and break above the multi-year high and rejection from there was strong, so short entry is advised with tight stops.

SO, Its always better to wait for price action to unfold in favor

It's always better to wait for much stronger assumptions, rather than waiting for price to offer a pullback entry to join the trend(If there is any and it has already offered few of them ), because it is not a sign of versatile trader, and when price is offering a reversal or counter-trend trade like this and we have seen an that happen as an example (Eur-usd) earlier, then we should take a less "risky" trade which offer good reward .

Wednesday, May 14, 2014

Candlesticks patterns and Context IN predicting overall price-action


It is very important to know that what is important in predicting overall trend , Is it pattern (candlesticks or chart ) or it is the logic behind the continuation or reversals.

For me, the candlesticks or any other chart pattern or any indicator combination tells you only the 10% of the whole trend, and that statement is very disappointing because even good pattern fails and you seems to look out for reversals too early untill it happens, and you avoid those timing because of earlier stops-outs.

Context can tell you what to look out for in patterns

Context can be anything and it could be correction bottom, yearly or daily extremes and weekly extremes breakout and consolidation area at the top after breakout and you need to be extra pro-active to see what price is doing after breaking out from a level. IF price has risen from a range and reverse immediate then it is said to be neutral behavior , and it could be the case of market expecting something from fundamentals, and you can never get any entry from these type of breakouts or look for confluence areas when such activity happens.

Below is eur/jpy daily chart in which I have emphasis on context

In this chart, the most important thing, is price making higher highs and holding on to those highs as well, and the conclusion one should not look for any short trade or reversals till market consolidates on large scale at top (lot of consolidation at the top area is also a strong point For reversal)

Previous high was yearly extreme, and market consolidates and give one breakout of a range pattern, which was strong one ans was faded out, but there we never get any strong liquidation which means that price can rise of from the low and this could be a swift move, and that exactly happen with a large breakout and test of that breakout.

Now we have seen the new price extreme and multi-year high and that high has been holding further development of price and price is in range after strong down movement and After going sideways price has managed to give strong breakouts of the range at top which faded out earlier, but support is holding . After strong tests price has manage to fall swiftly of that trap of strong above the high reversal pattern, and that type of patterns reverse the price most of the time and even this time price has faltered again and fall more than 300 pips.

Check the chart below !

So, the idea to post the above chart is not to derail anybody or discourage anybody from whatever he or she might be adopting, to predict the price action, but to tell you the most important point that is missing in your trading, i.e logic and when you know the logic behind the trading you can have few losses and that would be small one but your profit factor would be huge and you will how to ride the most part of the trend.

Friday, May 09, 2014

Most important thing to know as an Intra-day trader


The most important things to be kept in mind while you trade an Intra-day chart, which is "context" and Below is the example of eur/cad which In which strong conviction was to break to the upside, But one thing was with the bears was the background which was very weak after strong trend, we had immense selling and price totally was in range.

In a trend there are always two type of "participants" First of all, there are innovators and then motivators :) Numbers will not help you (it's not about probability at all :) ), they reflect patterns in human psychology. If you take the whole number of market participants (speculators) involved in a trend, you will probably see significant growth as trend emerges. Those numbers show approximate percentage of participation.

Update on how they use to trap and we should wait for complete close.

So, idea behind this chart is that we should wait and see the behavior, why they are offering low price to enter again, and allowing a pullback entry at cheaper prices and the reason I have mentioned Innovators start selling the price from top, and motivators try to trap you to join the trend once again,

But the result is often different as in this case and I am still looking for much powerful decline in the pair.

Thursday, May 08, 2014

Top-down analysis Yearly,Weekly and Daily Extremes


Here ! I’d like to share my ideas on top-down analysis with community. «Top-down» analysis is type of analysis that you do when you watch price action from big picture perspective.

Top-down analysis. Understanding different timeframes

«Top-down analysis» is not a «3-screen» system. Though it may be reasonable to analyze price chart on H1, D1 and W1 simultaneously but that’s not what I do. I use only M30 and D1. By «time-frames» I basically understand not charts but market participants with different perspective. First let’s make brief description on each timframe.

Notice – I’m not talking about retail traders with 100 dollars account, they can not move the market even on a distance of 1 pip, even if they will bring 10000 positions simultaneously in one direction.

I will be rather talking about interbank dealers, some of them will also act like day-traders – most of day time-frame traders will have no position until market close.

Domination

Core concept is that inside one period of time market is driven by certain market forces – either day-traders, short-term traders or institutional demand/supply. If market is dominated by day-traders, opportunity will be pretty limited. However, if market will be driven by institutional players, trend will be able to continue (market is supported by higher time-frame) Now let’s try to make classification of major market participants.

Day-traders

Professional day time-frame trader are usually market makers – in other words they tend to work near levels that accumulate enough volumes and avoid trading outside the range of the day. Reference points for them: previous day’s high and previous day’s low.

If you see that market goes exactly to previous day’s low and high, probably market is dominated by this group. It means that price action will have limited ability to go further in this case. Unless there are any clues for other time-frame trader (OTF), opportunity will remain to be limited.

Other-time-frame-traders !

Auction market theory has excellent word describing market participant that has perspective at least more than 1 day – «other timeframe trader». We don’t care whether market is driven by short-term swing trader or position trader from hedge fund – we assume that they have enough capital to move price and have some different perspective – what seems expensive for daytrader, maybe cheap for them. They even may not have charts – they make decision using other principles and criterias.

Stop running

Stop running process can be indication of OTF presence. Forex market has huge turnover and liquidity but positions of market participants are also huge – that’s why they often don’t have enough liquidity near certain price level to accumulate position. Remember – they don’t have brokers and buy/sell button. They have to deal with real interbank liquidity and accumulate position piece-by-piece.

If you see stop running in whatever direction, it may be indication of large OTF accumulating long/short.

Reference points

If you see that price is breaking out consistently weekly or monthly extremes (as well as 2-day or 3-day extremes), it can be indication that this instrument is «in play». We don’t know final destination though – it can be either short or long accumulation, we should remain flexible about destination.

That’s example of build up on Gbp/usd.

1. Price is breaking out previous days’ high (and possible executes stops of short sellers)

2. Price is breaking out high from (2 weeks high)

3. Price is breaking out previous week’ high.

This instrument is «in play». But what to expect? We can expect rapid movement in whatever direction. I personally was trading to the long side on violation of rotational center. But I failed to reverse this position though I had to – final destination was not defined. Nice move to the downside followed.

some trades updates ahead of ECB update


Price does reflect everything but when why every level is not important, Specially in strong trends while price bounces off support and resistance consistently, and provide you hints that price is about to reverse.

But when price start reacting with slow tempo, after the strong rallies, then still it would some more reasons for the reversals

Intra day Price action Reversals

The chart below of usd/chf is pointing towards test of high atleast but we have to cross that strong "new supply" for the price to gain momentum and react as expected and It has tried once but not succeed.

If we manage to stay below and manage to create a new low, then I would assume that downtrend is confirmed, but if we strong cover that area with ease, and price start gaining momentum, then short term reversal would confirmed.

Whenever we see opportunities, then we need to see the logic, means there has to advertising mechanism, when supply and demand exchange hands, and when that happens price use to trap retail traders, and when you plan to short rallies, ahead of big release then short covering give you heavy losses.

Now when stops have been taken both sides i.e longs and shorts price action has become neutral to breakout level. Below is my view about that opportunity.

Popular Posts