I have covered most part of these blog with "simple price action when there breakouts followed by neutral day minor developments and has no supply to hold the price to that level", which means that if we see some area is protected by the market strong holders then any spike and downside rally is always strongly protected by those areas.
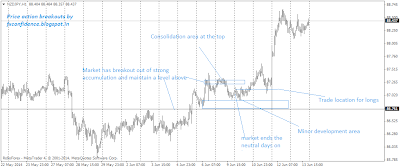
In the following chart I have covered a scenario (the most recent one), where you could tell yourself who is moving the market or who has the control on the price action next move
If you dig deeper than simply following price action, you will understand that supply and demand will drive the market. But supply can be short-term, then transform into demand and vice-e-versa. So, you have to rely on professional supply and professional demand and be able to distinguish it between other fluctuations.
Check this post how reference points works to find good trade locations
Charts often tells you what to do and to trade what you see, but when we relying on other things like candlesticks patterns or any other trading techniques we relying on them rather than we really on what chart trying to tell us and that is what basics of price action pure basics are. When market breakout from a level (Strong accumulation breakouts or range breakouts) and maintain a level above and we strong neutral day and minor development area and then market end the days on lows, then we have to see if there minor protection and development area and look to see the market reaction when price touch that development area again.
In the above chart of nzd/jpy strong trade location were there as there was minor consolidation areas were at the top and market really had no supply below to hold the prices there and the result was followed by strong demand.
Recent price action makes it clear where is ongoing demand

Blog is about Forex Trading for beginners. . Build forex trading strategies and make a living with Forex Trading.supply and demand price action, supply and demand zones, Price Action Techniques & learn to trade like banks and institutions
Saturday, June 14, 2014
Price action basic recent update when there was no supply
Subscribe to:
Post Comments (Atom)
No comments:
Post a Comment