Saturday, July 09, 2016

Trading Gold Futures Price Action l Fibonacci retracement and price action levels

News Trading- Trading True Trends

Its been target oriented week for usd/cad and Aud/cad pairs and Now the focus from there shift after the news section settles down and we can see new cash flow in the Currency market as talk shift to Fed's september rate hike after upbeat Non Farm Payroll last Friday. I have prepared a report on Euro dollar, pound dollar and commodities.

fibonacci levels for gold futures

Fibonacci Retracement levels for gold futures

Weekly chart of the Gold Futures refers to unfold correction and retracement levels towards 38.2% and If we see an rejection from here then probably we will witness a impulsive rally towards 1295 levels and from there we will see how price unfolds and If this assumption is right and we see a break below 1295 level and this will confirm the top and our next target would be 1250 and 1198 level in coming weeks. But we will have to be patient and wait for the price action to show some sign of top.

Gold Futures Price Action level

Read Gold futures price Chart and understand every move

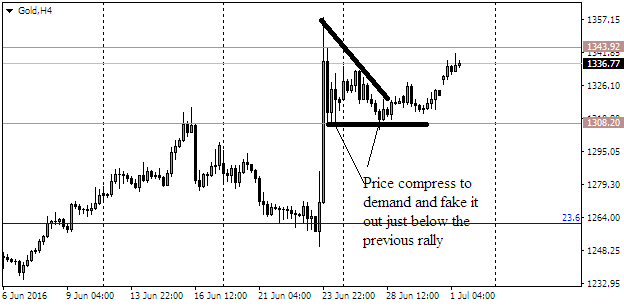
Gold futures has some strong history and open interest at historic level where price had fakeout the bull rally and strong rally after clearing supply with every move was a clear signal of new buyers found there at level and that is what I try to mention in the chart and Video below will really help you understand the "law of open Interest" at historic price action level and Now we need further price action to see if Price has reached the motive or target smart money was looking for and I would post an update If we see another level of interest or trading opportunity.

Wednesday, July 06, 2016

Trade Updates post RBA statement l Trading True trends in Forex

News Trading- Trading True Trends

First of all Look at the update I posted prior to RBA statement on 5th July 2016.

Australian dollar bullish sentiment RBA Cash Rate Statement

Just hours before the release I update the blog with two pairs looking strongly bullih and those were Aud/cad, and Aud/chf and they were trading at 0.9626 and 0.7238 relatively. I took the decision to go long because relative decision were made prior to the release and it was just noise that was cleared after the release and pair start trending again.

Updated Price Chart of Aud/cad

Forex news trading

Price was trading around 0.9626 area and risking 40 pips would have been very good idea as I posted on the previous article as decision was already made and there was just a question of price faking out the area for buy limit to get filled and it does reach to 0.9620 level which filled up pending limits and still was the cheapest price after moving market accumulation.

In next few hours, I would post few videos on the trade ideas and then you all would have some idea how I went about my trading decision just prior to the strong release and I Just confirm the swings and look for the possible reward and still I think pairs have quite a strong way to travel specially Aud/chf looking strongly bullish towards 0.7560 area.

You might also like to read :- Real time Trading Signals

Updated price chart of Aud/chf - News Trading


Tuesday, July 05, 2016

Forex Price Action tells us about clean set of orders l Forex Price Action Techniques

Forex Price Action and clean set of orders

I have published multiple articles on this blog to find you locate the Price action patterns which helps us in decision making and those areas could be consolidation,swing high or low, broken support or resistance rallies, drops and it helps us in locating true set of orders and levels that helps us in building strategies.Forex price action is really about finding levels or areas of concerns which help us find true set or clean orders and that is where all the trading strategies should be built to help us locating those levels.

How to trade Forex Price action

Without complete knowledge of price action and clean set of orders, traders can not bring technical analysis knowledge to find out location to manage the risk and If they are not aware of the source or origin of the move, there is no way one can find no risk or low risk opportunities to ride the complete swing. Traders applied candlesticks patterns at support resistance, swings or important levels specially fake pin bars, engulfing patterns and look out to find the true trend.

Price action entries

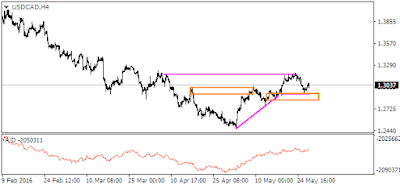
Time to add more longs to usd/cad existing entry

I have decided to one more long to usd/cad around 1.2980 area and earlier entry was taken around 1.2890 and both the stops are now placed around 1.2940 fro free ride to test 1.3090 and 1.3175, but it all depends on how price unfolds and how price retests the area around 1.3090.

Monday, July 04, 2016

Australian Dollar Trading Cash Rate Statement and Retail sale l Trade Diary for the week 3rd july 2016

Forex Trading Strategies- Beginners Forex Trading Course

Trading has been bit thin after the storm of Brexit that took all the currencies in to strong selling zone but Australian dollar has recover and reach to the level prior to the decision made by U.K voters. Outlook somewhat is quite bullish and with no expectation from the board members as they would like to keep the benchmark cash rate to record low around 1.75 for deposits, But there would be a RBA statement after that which would be a point of focus for traders.

Trade Ideas for Strong trending Pairs.

News trading News trading RBA statement

Trade recommendations for aud/cad and aud/chf which has been trending nicely after failure to hold the lows and looking to test the high and this should be a good time to add fresh longs to existing positions.

Friday, July 01, 2016

Commodities updates - Gold Futures targets and Crude oil watch

Forex Trading Strategies- Gold rallies fresh longs amid safe heaven

Gold futures longs with no risk was the best option to start off the week as price again fake the previous demand and create new demand and rally and last two days bull rally today tests 1341 area which was the first rejection point in the strong risk-off rally after "Brexit", panic offers new safe-heaven demand for gold and other commodities like silver and copper.

You might also like to read:- How to Trade Fibonacci Retracement

Gold and Silver are still the best option for longs in risk-off

Trading Gold Futures levels

Trading is close on gold and other commodities for Monday due to Independence day in U.S, but still I have enough profit in gold and looking to wind off the week with single trade that rally as expected. I would eye on silver now and would post inFibonacci Retracement section for next possible target for both gold and silver.

Monday, June 27, 2016

Trading Gold Futures- Updates Fresh Longs after Friday Rally

Forex Trading Strategies- Gold rallies fresh longs amid safe heaven

Gold has rallied up mostly in a single day in past two years and that is understandable when traders are looking for safe heaven after Risk in U.K. and recent price volatility in gbp crosses all around, traders are looking for safe-heaven and reason gold fresh longs can be seen again today and rally to test the multi-year high around 1365 can be tested again.

Gold futures Safe-heaven

Trading Gold Futures amid safe-heaven

Situation will be volatile, and I am expecting no respite till a resoultion is reached out or memorandum about how a debate and discussion will be reach to a decision that on which conditions UK will left EU and any news coming out of camp would certainly push panic in currency traders and price would behave erotically in recent weeks or even months.

Trade Diary For the week 27th June 2016 l Updates of Usd/cad

Building Trading Risk management Strategies

Friday I update the blog about the setup in usd/cad and risk of only 30 pips, brought another test of 1.3086 supply and now I am taking profits around 1.3050 area, and would look for the strength, If price test the area again and would like to see the approach.

Take a look at the post Usd/cad Long

We all know about risk in Currency trading, which drives the market broader way, but only few of them offer opportunities such as this and When it start to test important areas with strength, then it always do offer such low risk trading opportunities, which is well worth to try and make them work for you.

Updated chart of Loonie

Risk management trading

Friday, June 24, 2016

Trading is all about managing your risk Building Risk management strategies

Building Trading Risk management Strategies

Trading any market can be a challenge, and it often test the versatility of a trader but IF you have built up strategies that can help you understand lack of involvement or not too much liquidity or volume behind the moves, then you certainly can ignore various global risks that drives the market sentiment for longer period and that is what happen after "Brexit",Vote where "leave" camp dominates the voting launchpad,but I seriously never expect that much response to those results.

Bring simplicity to the trading and manage your risk properly

I expect the recent failure to close above strong supply is probably is last step towards eating up the remaining sell orders that has been left filled while price makes a large move down and it was the only supply in that range so to react with strongly bullish move price had to react and that is exactly what happened and now after this supply is consumed we can see move towards the earlier high above that 1.3115 area while price left this area and Now because of the low has been tested with even strong demand we can see new buying interest that make a new high above that and that could prove out to be very substantial move as Next area to watch is 1.3279.

Best way to manage any trade

There are numerous trading opportunities available on the table daily and you lookout for high probability trade and after you find one such trade, the next thing you do is to look manage your trade and manage the risk properly. There are not too many traders around who have used Money management as there prime tool to tackle the market and as in result high probability trades turn out to be a losing one.Have you ever try to add new position to your existing profitable one, specially when you trade in strong trending conditions and you think market has offered one pullback and good area to enter the market to make more profit.

Logical way to add another position to your profitable one

IF yes, then how would you mange that trade itself,as I often use to add another position If earlier position has given me 2 times of profit what I use to risk when I enter initially, so that means risking only 1 part of your profit to make more. e.g If you risk one part of your profit to enter at pullback and put the stops at your initial entry and IF in any case you stops get hit, you close that trade at breakeven, but this is the best way to manage your trade of making complete use of your trading plan and logical way to enter and exit the market.

Scaling out your position

Another way to manage your trade is to use "scaling out", which means that you reduce your position size as compare to what you enter initially, but it is not a good idea because it can totally take potential profit as you won't allow so many trending conditions daily and hence make full use when you are given a chance. "Scaling Out" is not a good idea because IF you enter with 2 lots and price moves 100 pips in your favor and you close that trade and again enter with 1 lot with the same stop at the price of your first entry, This seems illogical way to as you there is big chances that market went in your favor (specially when market is trending strongly),another 100 pips and you make much less that your first anticipate and this skills are must to have, If you want to use Money management to cope up with your directional bias.

Tuesday, June 21, 2016

Foerx Strategies-Fibonacci Retracement l Guide to trade fibonacci retracements and expansions

Forex Trading Strategies- Fibonacci Trading guide

In this section, I will explain How to use Fibonacci with combination of RSI to improve you trading results and trade trends most of the time as Fibonacci is a handy tool that let you know when to enter the market and use accurately over time by some legends and further improvement of this method has been seen.

Tools you need to use with Fibonacci Retracements method

Fibonacci is the most widely used term and every Forex trader new or experience is familiar with the term. Fibonacci is the tool that really can help you find true trends, pullbacks or Retracement and signal continuation of the larger trend.

Fibonacci retracement and expansions are the handy tool for entry and targets

We have seen people use fibonacci in elliott wave, harmonic trading and chart patterns for intraday and swing trading. But you need to have complete knowledge of swings on higher time frames as mostly fibonacci is used for reversal and one can really chase the trade too far If one has not experienced enough to know about Risk management and trading mechanical systems.

fibonacci Trading

Here you see 5 minute chart of nzd dollar where price is strongly in uptrend after retracing and you just need to put RSI of (14 period) and it should be above 50 which is neutrality period for traders and look for 5 minute chart and find a swing that is atleast 40 pips and mark this area as A, and Now you just need to find out If price retrace to 61.8% fibonacci and mark this area as point B,and If price rejects from there and close above 78.6% fibonacci which is point C which is our entry price and don't remember to put your stops and it should be place just few pips below 23.6% and in this case Entry price was at 0.7149 and stops were placed just below 0.7116 risking just 33 pips and there is another rule for your target.

It clearly upto you If you look to go 1:3 risk reward or whatever ratio you like, but If you want to stay in the trend for longer periods the You just need to find another strong swings of 40 pips and when you find and price start to retrace to 61.8% fibo and rejects from there you can simply put your stops just few pips below 23.6% and hence locking the initial profit and look to do the same and this is such a powerful system that If trend is too strong you would ride that trend for 2-3 days with risking not too many and locking your risk just on the day you enter.

Power of fibonacci trading Updated Chart nzd/usd

Our initial entry was around 0.7148 and stop was placed around 0.7115 so we risk 33 pips to get atleast same amount of pips in our favor.

We were given second entry at 0.7172 and then we luckily get our stops around 0.7148 which was our first entry price and that give us confidence of smart money involvement and levels at 5 minute chart.

Third entry was offered around 0.7232 and that time our stop and trailing stop is around 0.7217 and here we can look to book profits or can risk what we afford to risk earlier which was 32 pips and because of the fact swings are so strong it is risk well worth taking and see if we can take four time reward which is very rare on intraday trading chart.

If you would have risked 32 pips initially and set to breakeven at first swing at 0.7148, and now you can look to trail your profits around 0.7217 and trade the trend If you can risk 32 pips more to gain more otherwise you would have already got 100 pips target which is 1:3 risk reward and that is forex money management is all about and you just can't just let an entry go buy when you look to ride most of the trend.

Let's repeat the entry and exit system once again.

1. You should look for strong trends where Daily RSI should be in positive slope up or down.

2. look for 5 minute chart and look for strong spike of 40-45 pips in the direction of daily trend.

3. look for first retracement to 61.8% and then look for price to close above 78.6% fibonacci and put the stops few pips below 23.6%.

4. Exit only when you find a strong spike simply retraced below 23.6%. IF you get second swing similar to first one and that repeat the clause look to set price at breakeven .

5. When you get Third entry as I show in the above chart then you can look to book partial or full profit as you should not show greed and profit is alteast 1:3 when you enter first.

Saturday, June 18, 2016

Currency Outlook For the week June 20th l Trading Brexit Referendum

Fear of Brexit driving pound into extreme levels of trading

It has been really quite a rally since I posted the chart of gbp/usd and it has manage to engulf the decision point and supply above around the 1.4750-60 area is not far away and If price manage to react from here and ignore this decision point completely then you can certainly look out for longs around the 1.4650 area, if price tests this area with purpose. Chart below is prime example that only price decide whether there is supply or demand and when it approaches and rally is too strong, we should be aware of such price patterns that don't care strong levels but look for reaction only when price manage to test when there is no subsequent demand or supply area left on the opposite side.

Alternative scenario of Gbp/usd if bias turns bullish from here

Forex Reversals

This scenario was not favored at all but we have to respect the sentiment and if Brexit referendum failed to reach any decision and Britain manage to stay in Eurozone (Which I think is the best outcome for global market), then pound sentiment will again turn strongly bullish but volatility will remain subdued and price will rally for sure. Just another thought process and waiting game to see how price behave at new high or higher low If demand remain protected.

Monday, June 13, 2016

Fear of Brexit driving Pound into extreme levels of trading

Fear of Brexit driving pound into extreme levels of trading

We all have seen another volatile week for gbp/usd, reason being the news out of Britain Area regarding "Brexit" driving traders in fear of missing piece of puzzles, and hence some strong buy and sell orders but for me, its always been discipline and most crucial traded levels of rejection and one I have my eye on right now is crucial 1.4650 area, and that has been the point of focus for me right now .

Pound overall picture from Technical point of View

Brexit trading volatility

We have seen some strong rejection from highest levels and this can be another fakeout of demand and If we see some rejection in the box above in blue we can see massive selling at failure at supply levels, but we have to be patience and we have to wait for the sellers take position again from these levels as we have flipped again into the confluence of previous bull rally and rally to 1.4320 area, seems bulls hold the position again or we can see another phase of distribution around the levels I mention in the chart.

Focus has been shift to the two volatile events in the coming days and one of them is this week FOMC minutes, which has been the driver of US dollar Index Future at large and any statement made or failed to reach the set targets of inflation or employment numbers will give USD bears enough chance to drive the price lower and this can be once again the most favored scenario, but we will have to wait for the board members to justify their reason to hike or not to hike and this can really be volatile if there is no proof of another hike in coming months as employment numbers were very disappointed this month.

us dollar index

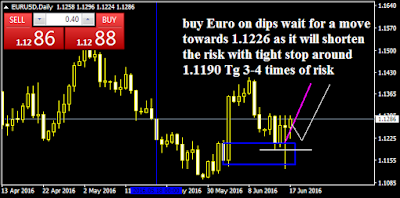
Currency Updates Buy Euro on Dips

It has been volatile week for Yen Crosses and fair risk after comments from Yen officials that they don't need further stimulus and happy with the recent recovery and these comments seen decent Yen appreciation, but focus is now shift on next week big Brexit referendum which will decide the fate of Britain residents, that whether they want to stay in Europe or would like to exit and that can really create panic and moves can go either way, so be patient and wait the storm to settle and it would be better If you don't schedule any trading activity during the next week because of uncertainty.

How to Trade Forex mean Reversals with logic and Reward

Tuesday, June 07, 2016

Trade Alerts

Forex Trading Strategies- Chart Reading step by Step

Forex Technical Update-Live Trade Gbp/usd 06 June 2016

Pair has managed to hold the gains after huge rally downwards to start of the week, but has show strength and focus is now shifted towards the high of 1.4750-60 area, I would wait for pullbacks towards 1.4450-60 for any retracement entry. Check the post and check the trading levels.

Live Trade Update-- Aud/jpy 05th June 2016

long entry was recommended around 79.55 levels and target was set around 80.67, Pair has manage to reach 80.40 and waiting for 80.67 first target to be achieved soon and from there new update would be posted.

Forex trading strategies-Fresh Usd/longs

Trade was recommended earlier after rejection of 1.2892, and idea was immediate rejection from strong supply in to demand and rejection offers very low risk reward opportunity and that is the reason I buy it around 1.2920 and took profit at 1.3050 when market rejects once again from the same area on Monday. Trade Update usd/cad

Forex Techncial Analysis Gbp/usd l Trade Alerts

Forex Trading Strategies- Chart Reading step by Step

Pound has manage to fake the previous price Action around 1.4356 and manage to breach the high of post NFP payroll data. Focus is now shift towards base of the current pause in rally around 1.4440 and trade alert section will be updated If we find any buy stops triggered at pullbacks.

Monday, June 06, 2016

Australian dollar trading RBA interest Rate Decison l Bullish outlook

Forex Trading Strategies- Chart Reading step by Step

Austalian dollar trading waiting for Bank official to meet and decide the future of Australian Economy, its GDP forecast, bank repo rate, lending rate and deposit rate and it is this is one of the major release that Australian dollar react to. After Friday bull rally, price action in all the Aussie pairs is waiting for banks to hold the cash and lending rate to the record low and maintain a dovish outlook overall as there is some signs of global recovery has been seen in China and other global trading partners.

Technical Analysis of all the Aussie Crosses

As I mention in my previous article, you must be aware of all the recent moves and collect those pieces to be able to know the future reaction of price and it will help you decide when to enter with lower risk and get the maximum reward and remain in trade for longer periods to make full use of risk reward and make profit upto the maximum or close to maximum potential.


Aud/jpy found support just below the previous low

Price Found support around 78.00 just below the previous low and faking out the previous swing low and faking out the strong demand or confluence level of the previous rally which makes a new high, I would like to remain in trade and watch for the next mention target and it is breached i would look for the new high just above the previous swing high.

Usd index future update, Interest rate decision trading methods

Australian dollar outlook bullish ahead of RBA rate decision

Outlook is positive for more gains and outlook is still quite bullish But adjusting of large orders can be seen and rally towards the low of 0.7298 cannot be ruled out and from there we can see rally continue towards 0.7450-80 area, which is good area to take profits and put stops under 0.7250 would offer good risk reward potential

Pair Australian Dollar Aud/usd
Entry buy stop at 0.7300
Stops @0.7240
First TG is today high around 0.7380
Second Target is 0.7460
Risk Reward 1/3.

Risk--High
Two things that favors our entry and one of them is we are not entering at market levels and so in bullish market we have to play the waiting game and look for potential large orders for the rally to catch enough sell orders and our stops are placed such as to give trade some room to breathe after the market settles down and second risk is not on as we have not seen big rallies up or down in world indices, so play safe is always recommended and entry and exit level rules are very strict.

Saturday, June 04, 2016

Forex Technical Analysis l How to read a currency Chart

Forex Trading Strategies- Chart Reading step by Step

Forex Technical Analysis is complete art in itself and You don't need to be Rocket scientist to read a Currency chart and Your technical knowledge will remain incomplete if you don't know Who hold the strong side on the chart and who is more likely to gain control in future. That market is most sentiment oriented which can turn its hands any time and it would take a session or two for a strong bull or bear trend will completely reverse, so it means you have to be cautious and can take all the time you need to access and implement what you learn in all those months or even years you spend

Forex Technical trading is all about who holds the edge, and if you want to compete with the best in the business, you need to be well versed with all the tools and need to stay ahead of the market

Chart reading or knowledge of complete Price Action is must and your decision making should be based only on levels and time spend near those levels which makes those levels even stronger when they are visit. Market always use to behave near those strong levels even for some spikes, which can be the result of consumed orders or strong pinbars which tell us the strength of the level again.

Step to step Technical Analysis

Chart above Canadian dollar/japanese yen without any explanation will put you in complete disarray what is happening but If I put some text on the same chart the you will have some idea why it is important to read every chart and understands what it is trying to tell and then plan your trading activity. Technical analysis should be easy to read and should only be based on price and its complete supply and demand structure, and time put behind such knowledge always give you an edge above others who use indicators, trendlines, fibo and Chart patterns like Head & shoulders, cup and handle etc.

Also read:--- How I manage to pick bottom in S&P--S&P Technical Analysis

Forex Technical Analysis--Step by Step Chart Reading

Above Chart tells the different story altogether,because every move is cleared in this chart and if you find such decisions been made on the chart the Forex Technical Analysis is logical otherwise they are just support and resistance areas which would surely be one or other way of failure.

If you see the above chart we have supply from where price fell a fair way away and then it found demand and compressed(cp) to supply faking it out and then this CP broke into demand and again faking it out and then rally to new highs which was another fakeout and price fall again.

While price fall of that new high it ignore the demand on its way down,creating new supply and price again found new demand and that first visit to supply (ignore demand become supply)was rejected and price then compressed to newly formed demand faking it out and went quickly for the second visit to supply and when it again went to the demand level which was consumed it just give false pinbar which tells that there was spike due to unfilled order and that unfilled orders now got consumed and price is ready to fall to the next demand level or decision making.

=======================================================================================

Tuesday, May 31, 2016

U.S Dollar Index Future l Forex Technical Outlook

Dollar Index Outlook and Direction for the month of June2016

Previously:- Dollar Index Future Long Term View

U.S Dollar Index broader outlook, which would cover major currencies like Pound, Euro,Usd/Cad and Usd/jpy

Gbp/usd Intraday Bias of Gbp/usd remains neutral to bearish as today's price seems strong enough for the bias to turn short term bearish and I am watching for a breach of 1.4450 support for a move towards 1.4331.

Speaking of direction in Gbp/usd, which is in strong downtrend on weekly and monthly time-frames but seems to recover well on daily and shorter time frames, but It could turnout to be a small correction of higher time frames.

As I have mention in the chart that price has Fakeout previous two highs and went straight in to supply and that high prove to be vital to cap the bull rally (which seems to be strong enough) as there was a serious buyers trap just above the previous high and today's price action has covered all the buy stops and that minor rally to 1.4650 turned out to be the biggest of buyer's trap pound has offer just recently. I have witness such Price Action in Pound in recent months and those trap rallies really pick momentum going into big impact release like ECB policy decision, as Further stimulus package announce by Mr. Draghi can really put panic in usd bears, so strong rallies can be seen by U.S dollar bulls .

Previously Reason of recent Gold Futures Prices short ralliy

Technical Outlook For the Pound

I will cover the outlook of the Major currencies covered under U.S Dollar Index for the Month of June 2016. Direction outlook for the pound has turned bearish again but I need further Confirmation of the trend as I am still waiting for the lows of 1.4450 to be breached for a move towards possible 1.4045.

You can expect choppy or sideways Price Action for couple of sessions, but still my sell order would remain intact till the weekend and we have still three more days till the market close on Friday and have enough room for the order to click and If things goes right we can surely sees one or couple of the Target get achieved, bearing in mind the volatility to pick up due to high impact release to be scheduled during weekend.

Gbp/usd pending sell stop @1.4450 stops 1.4510
Tg First 1.4310
Tg second 1.4215
Tg Third 1.4090

Eur/USD outlook for the short to medium term is neutral to bearish as We have seen the pair has rejected once again from the highs and has not stopped yet and I would wait and watch If price tests the 1.1060 area in the coming days .

Speaking of direction of Eur/usd, Pair has compressed to the top and recent rejection from the overall supply look strong but recent support around 1.1050-90 area, seems to be holding the pair for too long, but it is understood when High impact release like ECB policy decision is scheduled to be released on Thursday, and Market wanted the view of Mr. Draghi if he is dovish about more stimulus and Gdp forecast for the remaining of the year, would certainly move the pair and there won't be any choppiness for sure.

How to use Open Interest beyond swings on Chart

I prepare this video specially for the newbies and this video is must to watch and part of our Forex Trading Course For beginners, and covers how to use open interest beyond the ultimate swings specially when strong trend reverses immediately.

Recent Rise in U.S Dollar Index and fall in Silver Prices are quite similar to the video mentioned below which has cover most part of my trading techniques, which I used over the years and have edge over other fellow traders.
If I got enough requests then I would post my recent trade of Silver Futures, which I use in the following recommended manner and short Silver Future around 17.75 and my target is 15.60 area.


Trade Watch Pair Gbp/usd


Trade Update Stop out at break even Price went in favor for around 70 pips, but rally strongly after NFP released.

Monday, May 30, 2016

U.S Dollar Index-- DXY long Term View

U.S Dollar Index-- long Term View Sentiment Bullish

The US Dollar Index (USDX, DXY) is an index (or measure) of the value of the United States dollar relative to a basket of foreign currencies,and it is the most traded currency against all other currencies because USDX is also termed as International Currency and often used as reserves by countries

Usd Dollar Index Weighted Value against other Major Currencies

It is a weighted geometric mean of the dollar's value relative to other select currencies:
*Euro (EUR), 57.6% weight
*Japanese yen (JPY) 13.6% weight
*Pound sterling (GBP), 11.9% weight
*Canadian dollar (CAD), 9.1% weight
*Swedish krona (SEK), 4.2% weight
*Swiss franc (CHF) 3.6% weight

U.S Dollar Index is made up of 6 Currencies, (eventually 24 because 19 of the European Countries who have adopted Euro as their common currency) plus the other major countries like Japan, Sweden, Switzerland and Great Britain and their common currencies.

As mentioned in the above Example with the 19 countries, euro has make up a big chunk of U.S Dollar Index(57.6%), and the next is Japanese yen which is not a big surprise as Japan (13.6%)is also one of the biggest Economies of the world and rest 30% weight of U.S Dollar Index is shared by other four.

One thing that we must kept in mind that you don't need extra skills to trade U.S Dollar Index as You just need to look at sentiment, swings and opportunity to time your trade and If you are having problem accessing situations then U.S Dollar Index can surely give you idea about the direction and things to come and hence you can avoid choppy Market situations. U.S Dollar Index is directly related with U.S GDP and long term bank policy decisions.

Federation Chairman Mr. Ben Bernanke, Apply Quantitative easing or extended stimulus after 2008 Market Crash, For Few years and hence it really stem the U.S Dollar again its counterpart to strengthen economy and print money to put that money in to economy and offer employment opportunities and stimulus package to buy back negative yield bonds and hence strengthening banks and provide them more liquidity or funds to run bank system smoothly.

There are also some interesting facts that when Euro moves, which really moves US dollar index because Euro covers the most portion of USDX, and because USDX is so heavily influenced by the euro, traders have looked to trade Euro as the highest portion of the Currency Volume throughout globally.

How we can use US Index In Trading Currencies

I hope you have got the slightest Idea, "How you can use US Index in your trading?"

If not, you will soon get an idea, as we all know that most of the widely traded currency pairs include the U.S Dollar. IF you still wandering then U.S Dollar based Currencies are Eur/Usd, Gbp/Usd, Usd/jpy, Usd/Chf and Aud/Usd, Usd/Cad

Well, hold your trigger finger and you’ll soon find out! We all know that most of the widely traded currency pairs include the U.S. dollar. If you don’t know, some that include the U.S. dollar are EUR/USD, GBP/USD, USD/CHF, USD/JPY, and USD/CAD.

So, In broader terms If you trade any of these pairs, the U.S index move and if you dont, the US Index will still give you an idea of how weak or strong the U.S Index around the world. In fact, when the market sentiment of U.S dollar is unclear, U.S Index provides you better picture.

As we all know US Index comprised of more than 50% of weighted value of Euro, Euro/Usd chart can be exactly inverse of U.S Dollar Index.

Technical Analyze of USD/jpy

U.S dollar is on the Radar Since there have been talks of Fed Rate Hike and it has picked up since the first rate hike in the last December and hence I always recommend staying long instead of just waiting for things to happen or most of the moves have been finished when the action is performed.

US dollar future to dominate pound exchange rate in coming futureI would like prices of pound sterling to remain in long bearish mode and it could even turn out to be best run of Us dollar future against single currency of U.K. also referred as british pound.

US dollar update 4th October 2016.

US dollar bulls very cautious ahead of NFP data I have seen lot of bull rallies of US dollar fake about the recent range and I would like to see this failure again and would look to see the reaction at the low of range again.

Sunday, May 29, 2016

Trading Gold Futures Contracts

Weekly Outlook for Gold Futures Gold Futures

What does Gold Futures contract means

Gold Future contract is a legally binding agreement for delivery of gold in the future at a agree-upon price. These type of Gold Futures contracts are standardized by Gold Futures exchange as to quantity, quality, time and place of delivery i.e physical delivery will be with the difference between the Gold Future price at the time of contract and actual price at the time of delivery.

Market Participants facilitate trading without Physical delivery of Gold Futures

Market participants or hedgers use these type of contracts as a way to manage their purchase or sale of physical with providing speculators or investors with an opportunity to participate in the markets and trade Gold Futures without any physical backing, but only with agreed upon the price with a difference of opening and closing of a trade of Gold Futures.

Why Gold Futures or any Other Precious Metals Futures

There are few aspects that need to be cover and one of them is that Precious metals Gold Futures or Silver Futures are traded over centralized exchanges and because of the centralized exchanges, Gold or silver futures offers more financial leverage, flexibility and financial integrity than trading Gold Futures with the contracts. Let me emphasis on the point more that Financial leverage is the ability to trade and manage the high market value product like Gold Futures with a fraction of total value. Trading Futures contracts is done with performance margin. It requires considerably less capital that the physical market and because there is high leverage used in Currency Market and it provides speculators a higher risk/high return investment.

Bias of Gold Futures Remains on the downside-Technical outlook for the week May30-June3

Weekly outlook for Gold Futures as We can expect bit of choppy sessions in this week due to two huge release scheduled at the weekend and i.e ECB policy decisions and NFP data. We can see risk falling through if there is any unexpected policy decisions being made by ECB bank officials and followed by Big change in participation rate in coming event of NFP data which is scheduled to released this Friday and the last NFP report before then next FED meet scheduled to release later this month. Any change in Unemployment rate up or down would certainly put risk at glance and drive Gold Future prices with volatility.


Gold Futures

:: sell Gold Futures @1212 with stops around 1229.
::First Target 1200
::Second Target 1182

I always advice setting two pending orders and expiry is 48 hours. Close one order around 1200 and trail the rest around 1216 with risking 16 points to make another 16


Trade watch Gold Futures

After First Target was reached and profits were booked, waiting for the second target and stop out at break even of the second lot.

EMA Trading Strategy 200 EMA 50 EMA cross over l Built powerful system with EMA Crossover Strategy

Forex Trading Strategies-EMA Trading Strategy

One of the famous strategy that everybody should be aware of trading currency or any trading market is EMA trading strategy which is also know as "Moving Average Strategy", and the rules are simple when a particular period of EMA (Exponential Moving Average), cross other EMA of set period then we trade the cross in the direction of the price and we need to have some strict money management rules to trade any strategy and same rules applies to EMA trading strategy as well.

EMA trading system setup or Moving Average Crossover system

As we all know that every mechanical system is lagging but If we look in to the scenarios and apply few filters and look for overall sentiment then we can make any system as powerful as it can be and there are strict Forex Money Management rules that we need to follow while trading crossover.

Look at the following chart for example.

Forex trading systems

This is the Euro Dollar Chart of 20th June 2016, in which price is in strong bullish momentum after recent fall from the top but manage to cross the EMA period (35,20),and upward slope is solid and resistance turned out support is holding and that is what we should be looking to trade EMA Crossover strategy, in which price should test after cross and atleast make a new high in last 5 days, and today we saw a big opening up gap and price is looking to fill the gap and meantime testing the EMA as well, and If we see after testing Candle manage to close above the open and we set a pending buy limit 10 pips above the last candle high prices and set the stop 10 pips below the lower low of the signal candle, but make sure momentum does not fade out too much as there should not too much sideways movement after price has rallied high or even while price testing the EMA or support whatever suits the scenario.

Filters to be used in EMA Trading Strategy

***Price should make a new 5 days High and crossover should be strong

***Entry Should always be made at retest

***Price should never goes sideways after making a new 5 day high or while retesting EMA or Support or Resistance

***Entry Candle after retesting EMA or support or resistance should close above its open.

***Entry should be +/-10 pips above or below the low of Signal Candle and same rules stops should always be +/-10 pips of the same candle.

***Strict Forex Money Management Rules are the key to this cross over system and Risk to Reward should always be 1:2 or 1:3

Another Example of EMA Cross over strategy Gbp/jpy 20th June 2016

EMa strategy

We are here looking for another short setup in gbp/jpy which has managed to break below strong support zone and it also was the multi year low and we are still bearish to the pair till we get a strong weekly bullish candle signals the change in momentum.

However, we now need to see the chart if it fulfill all the necessary requirement that we mentioned in the above checklist as this went straight into the resistance and could be another trap if price manage to trade below the indecision candle.

200 Period EMA filters the Noise
Ema trading system, trend trading

Here is One EMA (200) period, which is used to filter the noise as it is the most used EMA world wide to see the slop of the trend up or down and IF 200 period EMA is flat, then there are lot of sideway movement can be expected, and one more thing I would like to mention here that in case of sudden reversals in overall large dominate trends, up or down price use to test 200 period EMA and use to reverse again after testing down the EMA.

There are numerous filters used with EMA throughout the world with success and one of the widely use filter is trendline and slope of EMA and trendline most probably filter the noise from the chart as it can only happens in strong trend, and trader use to target exotic pairs to trade EMA as usually they require less time to watch too many market data and spend tons of hours for setups. One thing is sure that there is no trend building up without Ema Crossover, but we have to decide which crossover we should use and what combinations we should use to make the system more powerful and hence worth using and making the system work for you in the long run.

Trade EMA with high low, ranges and breakouts and retests

EMA 200 Strategy,EMA Crossover system

The above Chart of Loonie tell us the power of 200 EMA cross over and we have to look for the slope and If it is too strong slop and we have ranges above or below, then we can have the idea while price reach and expect to react at EMA 200 period. EMA 200 is so powerful and IF you have knowledge and practice of low high, ranges and breakouts with support and resistance, then low risk entries can prove to be very strong risk reward opportunity.

In first case we have almost 2 months range, which make a new high and rejection from there made a strong base at 200 period EMA, as price went into tight channel while it test the EMA. And after price Rejects from 200 period EMA, it rallied. We can have the same scenario facing up in the next setup where we have tight ranges and rejection and price went into channel to test 200 period EMA and rejection from there price resume the trend and we can have large range or we can see large bearish trend resume from here and it could be very good opportunity IF we place the stops above the second rejection which was at S/R flip as well.

How we can use EMA 20,50,200 with Bollinger bands and Other indicators Step to step guidlines on how we can use EMA's of different value for day trading and for swing trading with the help of different indicators like RSI,Bollinger bands and Stochastic oscillator.

Here in this forex market there are several powerful trading system based on several indicators but ema forex trading strategy is vastly used and is included in almost every Forex strategy. If you are good at controlling risk and have patience to wait for entries on higher time frames then it is the nest way to use ema to filter trend and wait retest of ema and specially if it is a confluence or any fibonacci number or strong demand areas.

How to choose best Forex Trading Strategies l Forex Secrets

Forex Trading Strategies- Beginners Forex Trading Course

Over years, there are millions of Forex Trading Strategies have been invented and used successfully and best part is that without caring about what the fundamental impact would be over the coming days, those strategies give results in longer terms, and this is the best part of trading with Technical Analysis that You don't care what impact news would have and how much movement it is possible, but still there is lot of noise and selection of time frames filter the noise and whenever you choose any system or mechanical method to predict the future price, You need to have the complete knowledge of every time-frame from monthly to five minute chart as it will clear most of the doubts creeping out of your mind. However, with time retail traders develop the different methods of predicting the future price and they use it to predict any market currency, future, metal or energy.

In this section I would probably discuss the best methods to predict the Future price of any currency pair, but it should be completely tested over time and targets to make the best use of any system as it will enable you to understand drawbacks and sentiment which works best for the system you use. .

Most Famous and best strategies to Trade Forex

***EMA Trading Strategy

EMA trading Strategy is most simple and famous and the best choice for comers to predict the market movement and It is probably the first one to tell you that pullback is over and Trend is about to resume. yes, this is the best way to trade EMA that You look out for pullbacks rather than looking for reversals. Take a look at EMA trading Strategy

***Fibonacci strategy to predict market movement

Fibonacci method has been used by bunch of traders and professionals that are using Elliott wave to predict the future price and pattern of five impulsive and three corrective waves provide lot of accuracy and early warning to call the bottom and top, but this post is not about Elliot wave as I have easiest way to use Fibonacci with combination of RSI to give you best strategy to trade trend and with the strategy, You can never miss an early entry to multi-week trend and with only 20-30 pips of stops. Check how you can use Fibonacci Method to improve Trading Results.

Friday, May 27, 2016

Can we really make a living out of Forex

Currency trading for a living or as full time Job

Hi,Its been quite a choppy price Action again through the week due to lack of high impact news and it never works for a trader to plan any trading activity when there is lack of participation from a group of traders whether bulls or bears. Forex Trading is somewhat different from Stock Trading and you need to learn different price Action Techniques which you use in stock trading to make living out of Forex. Definitely, there are immense opportunities, but need to remain selective in your approach while Trading Forex and make it work for you and make a living out of Forex Trading.

Forex for a living, Forex Secrets

Things you must need to know If you want to make a living out of Forex

First question that comes to mind of every trader who want to make a living out of Forex is How much capital do he/she needs to invest to make a substantial profit and rely on Forex to make a living. It is really important to know that amount of capital a trader can invest can totally rate their ability to make a living from trading. In fact, capital plays a vital role in making decision and large capital can offer great returns. A trader's skills to access size when condition does suits the style one adopt is really separates a skilled trader from other novice or amateur trader.

Also Read:-- My Best Trade Recommendations


How to Rate a Forex Trader Performance

Trust of the fact is that Trader's performance is dependent on various factors. One of the main factor that a trader who want to trade Forex for a living is the control and the ability to analyze market, but what does we do as a beginner is to invest small capital and dream of making millions in short span of time. So, where does a trader look to rely on circumstances which are unlikely to occur, whether one accumulate profits and compound it over time, still you have to use leverage to take unnecessary risks to build their account in short time or pressure of making a definite amount If you rely on Forex For a living and they dream of making 10 times or even double their accounts in a month or two .

Forex Leverage a double edge sword

Leverage is one tool which offers high reward couple with high risk as well. So, If you don't learn the technique of money management correctly, the benefits of leverage won't really work for you at all. Leverage does allow a trader to take large positions but leverage is not dealt with the care that it should be. On an average day trader look to make 10-20 pips a day on $1000 account and try to make $2000 quickly, may work for a shorter period, but in long run one should learn to adopt few rules and learn to build their account slowly if one want to make a living out of Forex. As the account grows the trader may be able to make a living off the trading, but attempting to make a living off a small account will surely more likely result in increased risks, excessive use of leverage would more often resulted in excessive losses.

Trade Setups and Trade Diary for the Next Week
Trading for living

I would cover more points in the coming weeks and months which would clear all the thoughts of preparing yourself If you want to make a living out of Forex and post of the articles to tell whether You can really rely on Forex for living.

Tuesday, May 24, 2016

Pound is still bullish of all the major Currencies True Trend

How to find trending Currencies pairs

Its been quite sessions all the way this week amid lack of participation of strong holders, but Pound dollar is exception to the as it is trading with clear swings up and down. I found this pair to found some hurdles ahead of 1.4610-25 area, but when it is clear we certainly keep an eye on 1.4661. Chart explains that pound certainly found some bulk orders at previous area of demand and supply zones and it often happens when a pair like "Sterling", can't hold it too much in choppy market conditions and there is always happening something that really can fuel bulls and bears to participate.

Also read :--- How to make a living out of Trading

Entry long was offered at 1.4485 low with minimum risk and hence it was well worthy to test 1.4600, hence I got in and out early because bit of downside rally to test can be seen and if 1.4661 is cleared then it would clear the hurdle to clear the supply and higher prices can be seen.

Clean set of orders in bullish market

I always enjoy clear swings and set of demand and supply to make me feel that how much risk can be taken to see if price manage to test the high of supply and that's why I always watch 95% of the time and take action only 5% of time and I really enjoy such trades which falls for true demand and supply with complete new set of orders and Cash flow at the start of sessions, specially if it is one of the active sessions.

Also watch:- How I was sure of Rise in Gbp/usd

Sunday, May 22, 2016

Trading supply and demand approach and Reaction at Crucial tests

Trading price actions tests of sell-off and reaction Price action techniques

It has been a treat to keep updating the blogs and thanks for the requests at youtube channels and also in emails . This post is all about how we manage to trade higher time frames tests and approach. As you all know Price is Fractal and We all look for historical monthly and weekly charts to better analyze our trade entries and look for better areas to put our stops and maximize our profit targets. But Indeed, If you every know what is market is about to do or react you don't really need to use stops at all or even few pips even at higher time frames because market set pending orders during test at pin point levels and It could be psychological tests barrier like 50,00 or it could be at strong supply tests.

It is a fact that during the free fall or news price did not manage to collect all the orders that it need so that is why sometime we see facts that market recover in seconds when news is released and price start to cover.

What happen in such Cases, Price recovered and test the origin of the fall and see If market reacts to it or If price has engulf the crucial support or demand we do really see a reaction when it gets to the origin of the move.


I was asked same question several times about one of my video post at youtube channel and It has really forced me to come up with a solution which is easily understood and help you manage and decide your trades accordingly.

Some pairs rise after consumption of supply immediately and fall after there is no buyers left and all the demand buckets gets filled or you have seen enough evidence of Distribution Phase or few traps after the completion of distribution phase. As these levels are easy to spot when a uptrend collapse and hints us the end of phase.

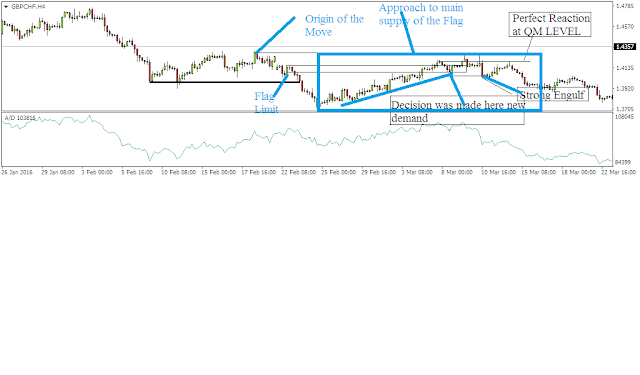
But Currency trading is somewhat different from Stocks and Indexes as there are trends does seems to stay there forever till they are finally signs of reversal seen on monthly and higher time frames and the above example is just a an small example that long term downtrend is about to resume and it can also called "redistribution", and in the example shown above is simple approach of supply and rejection and rise to "QM level", when price engulfs the demand and approach the supply again.

Then what you need to do while see such scenario set pending orders and set stops because market is going to test the next decision point if found pending orders on those areas.

Thursday, May 19, 2016

How to separate Frustration and Emotions from your trading.

Frustration often is result of Expectations

We all learn several techniques as a Trader, even we use same in stock, commodity and Forex or Future market, and those strategies have been used by traders since the inception of Trading, but why then they have been so successful and why we are not and the shocking answer is Frustration which brings emotions in trading that really destroy every mindset or change it for a while. Frustration can really of several type as not understanding the market price action or poorly time trade without knowing the result or reward of that trade making mistakes which could easily be avoided. Reason of raising this matter is the case that has happened to me just recently where I was stopped twice of my pound sterling trade and succeed only once but that does not patter. IF we buy and sell at the same place then It really frustrate your mind as all those several years spend in trading can really be of no use.

Pound bulls attack 1.4661 Crucial Turning pont

Forex Currency Trading Turning Points

Situation has completely changed in Pound dollar after I post yesterday that pound will look or a decline from 14580 but It has mange to break it with ease and manage to go close 1.4661 which is clear defining point between bulls and bears. But I would put on my bet on the bull side for a ride towards 1.5035, no matter what happens to Fed and BOE.


Could be the case of buy stops and sell stops stack orders

IF you watch the chart posted carefully above, then you can probably see that If price has managed to give sellers and buyers both any chance to dominate and When It is the case price is trying to consume all the supply to buy at best of the price, and If that is the case then price probably will become volatile and all the bulls and new cash flow will be punched into the market.

Wednesday, May 18, 2016

Pound Rise due to Brexit postive Report but headwinds Ahead of FOMC

Financial Market Traps Brexit Report Releases ahead of FOMC

We saw pound sideways movement through this Month of May after expecting Price to move ahead but it got trap in ranges till Today Brexit Poll Report shows Remain leads to 55/45, really pumps Pound bulls and pound Rise to as more than 150 pips from the daily lows and "Do We need to use our brains to know the Situation that why that move happened ahead of FOMC Report", may be We don't really are too serious about the unexpected even but that is seen on chart. Price Was due to bounce from lows and create new high and let trader guessing ahead of FOMC report.

If market manage to gather or pick all the buy orders in that move which took place after the Release of Employment and Earning Index From Britain, then this could be a biggest trap ahead of FOMC meeting. I can see a Trap waiting and FOMC Report has to be published with 6 hours from now, but Really maintain and staying above that breakout will really put lot of doubt in traders mind that consolidation breakout is looking quite bullish and positive data supporting that move and there is no chance of reversal. But You need to stay ahead and see who is in control, Bears can dominate and take the benefit of squeezing all buy orders and sell at the best price.

Trade pound dollar employment and earning data

Buy orders squeeze in Gbp Ahead of FOMC Report

> This Article might change the way you approach forex market completely. I will update the Article before the release of FOMC report to let you take benefit of this report.

Saturday, May 14, 2016

How to select Currency Pairs to trade Trending Or Sideways

Best Trending Currency Pairs

Since I have start trading Forex, It took me while to understand which pairs should I line up for the next week. So, I decided to target News calendar for that Purpose and see which Currency Pair has high impact releases to be Scheduled next week and then I decided to take with the trend entries only and upcoming reports should match with trend entry. But that did not work for me in the long run as I struggle to find out the reason why currency pairs reverse even after strong data in favor. Strong Release does move pairs but If that release brings risk aversion, then It can reverse totally, but Chart should be decisive enough for us to make crucial decision at such events.

Well, It is quite clear that only few major pairs dominate the market volume as it is prime choice of bunch of traders, and every strategy you built in may not suit every currency pair, because few currency pairs offer strong movements and volatility, they still might not be best one to trade at particular scenarios, specially at the time of release. Australian Dollar, Canadian Dollar, Eurodollar, Pound dollar and Dollar Yen are prefferrable choice for every trader to look for their profits but still there might be few correlated pairs that you can use to hedge positions but still You does need to see enough reason to trade the rest of the currency pairs that offer movement and are trending as well.

There are so many factors that influence the movement of a Currency Pairs event after positive data release that should offer strength and good enough to buy but still it moves lower and trade has to be close due to loss. Its a trader's responsibility to track which currency pair is dominating e.g Dollar has been dominate against pound since last year or so and When You expect couple of news can drive sterling higher or reverse the trade, then You should built several strategy that offer entries in trending market.

Let's be more decisive with the chart to clear Doubts raising in your mind

best currency pairs to trade

Pound Policy Statement and Inflation Report

These two reports were the highlights of previous week as Pound was moving sideways for extended period in expectation of this release and as You see in daily chart pair has already reverse and that bearish movement was quite significant and one should always look for short entries If trend start to reverse of a new high.

Let’s take the above scenario from another perspective:-

There is another perspective that You can take it from above example as you expect British pound to increase in Value, so you want to buy pound. But instead of just look to buy pound against the dollar, you search for the most suited pair to do it with. And after bit of search you find that Australian dollar has been the extremely weaker of all the currency pairs, and you decide that you will buy Strong Pound against Weak Australian Dollar and this works well If you would have been able to do that because it was weakest pair of all on that day.

That's How I find Trending Currency Pairs with Logic and timing


buying the weakest currency

In the example above, you might have get the idea How banks target different currency pairs at different scenarios and How just a big of understanding of the logic and overall context can offer you sense to buy best currency pairs in the trending market even with weak reports which is unexpected scenario but still quite profitable one if you manage to use bit of research and choose optimal currency pair.

Friday, May 13, 2016

How to trade confidently in any global or domestic Market.

How to trade with confidence in any Market

Hi, readers, As I have stated in my previous articles that Trading Price Action is all about confidence, but Price Action does involve lot of logic and sense and it is never about doing what we are not suppose to do and by that I means taking choppy market into consideration and letting a loss run expecting that price will come back to your entry again and in expectation drag your too far and get loss more than you first anticipate and that what we all suppose to do what We never or ever should be doing.

trade forex with Confidence

Trading with psychological edge should be our first motive and that really put you far from the hurdle who trade for just profit and don't consider why a high probability setups is something we all have to look for rather than high frequency of volume which increases the chances of losses more than chance of winning. Volumes never brings profit as there is always a risk of giving back the profit your earn when you try too much out of Thin Market and specially when trading is So thin like this week and We must observe what price action should do after breakouts in such thin trading sessions.


Euro dollar technical

How I manage to Read the context in Price Action


I thought about taking few Price Action setups of Euro dollar several times this week, but really Price Action did not allow me to do so and hence I drop the Idea of taking any setup and watch if market offers any trap and failed breakout, and today I find out that breakout yesterday was a false trap and another trendline rejection would allow me lot less risky entry than I think of it at first sight, and that is how price action behave after the rejection top which was the base of the selling and because of the fact market compressed to decision point, there was good chance of rejection at trendline as most traders would set pending buy orders at trendlines and that was no exception and Price make a new low today and a setup which initially have few doubts but nothing after rejection as I made my mind to sell at close of rejecting Candle.


Also Read:- Watch How I Recommend Selling Euro After weak US Employment Data

So,a setup which was looking like breakout of choppy conditions again failed and market was free to fall after the rejection as chances of bounce were very often in such cases and risk was minimal to zero as We never look to drag the trade and set small stops and look to close when market find a new low with momentum.

Popular Posts