Showing posts with label price action basics. Show all posts

Thursday, October 09, 2014

Price Action Basics Educations purpose

Strong holders vs weak holders

Ok, now if we have distinguished weak holders from strong holders. And what we really have to do - we want to know, at least to assume what professional players are doing. By professional players I mean dealers or institutions that have to consistently deal with big volumes and give their clients at least average good fills. Institutional activity When we are talking about institutional activity, we are talking about strong holders. That guys have almost unlimited buying power at their disposal, but it doesn't mean that they want take money from you, they usually have large order from their clients. It not always means that they want to purchase from weak holder, squeeze them and hunt for their stops. They just want to accumulate position not squeezing price against themselves. First of all, if you look at this chart, how do think, where (on what prices) institutional player was buying (if he was buying at all here)?

 photo asdasdasd_zps7fd81119.jpg

Expected answer is that they were buying at lower level. But think about their volumes. They are big enough, and they simply would not have enough liquidity to build a position there. They usually have to accumulate - to buy several times, to absorb somebody's sell orders. Otherwise they will not have enough liquidity and make prices grow immediately So, their buying will be distributed within whole trading range:

 photo 123qwe_zpsa92ac228.jpg

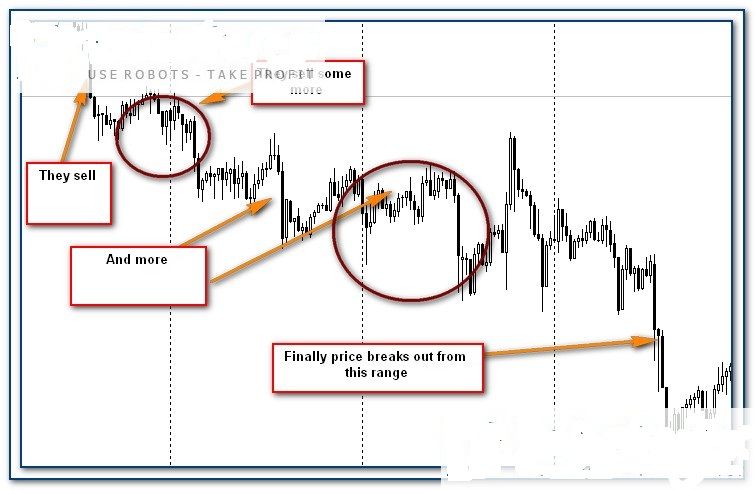
And the first clue of institutional activity is acummulation on moving market (rising or falling market). They don't have enough order flow going down to absorb, so they have to squeeze prices a bit, but nevertheless they have good average price, not the worst of the period. It's a wave-like process. It ends with a breakout
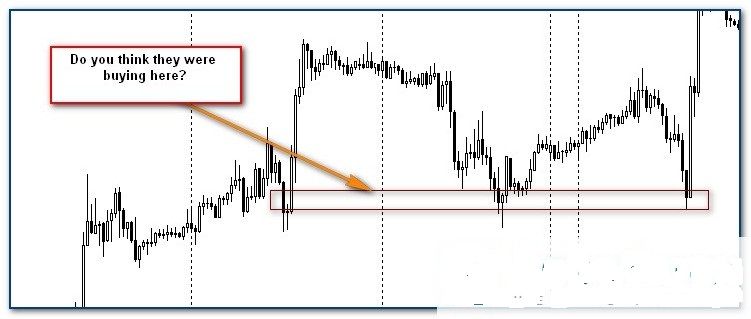
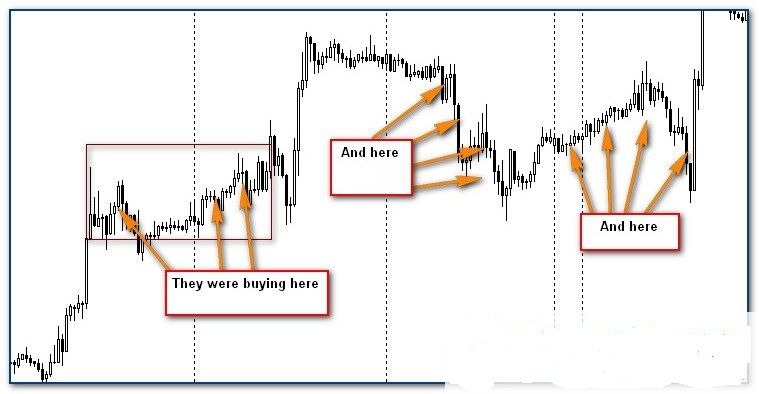
 photo range_smarts_zps3eda1ab8.jpg

Tuesday, August 26, 2014

How to spot Intraday Scalping opportunities.

Scalping for Intra-day trading

In this post I would like to cover few points when you scalp for Intraday purpose.

The first thing you need to spot is to see If there is imbalance still presence (First clue always is neutral day after breakout where seller's are passive)

Second thing to see if there is minor development area after breakout (Say if there is aggressive to mark the price again to the up after minor sell-off)

After minor development area, Price again end where it starts (End up as neutral day which will confirm that imbalance is still present in the market)

After you see these clues the next important area is what price does after testing that minor development area, if it show immediate aggressive buying then you can immediately enter the market but if that momentum fades out earlier you should get out quickly. For me the best clue is often the slow tempo, and then suddenly price breaks the equilibrium after the minor rotation area breakout and test and you can get some nice profits as in this case in the above mentioned chart.

Moving Market accumulation Price Action Basics

Moving Market accumulation after strong breakouts

IN this topic I would like to cover the most important point where we can see strong buyers or strong money participation and "Accumulation of Moving Market" is a good example of this. Not most of the traders are aware of this fact that accumulation process can be done on moving market specially when we strong liquidation after this process and we see some strong "Protection Area" (As shown In the chart) is a good indication of strong money Participation.

Chart of eur/jpy simplifies the post

In the chart I posted above we have seen some strong accumulation which means that there is strong supply in the market and price rises of that low and that In order to move the price we see strong money slowly accumulates the price.

We use to see strong momentum building through the mid of the day and tempo is very low at the extreme which is a strong sign of "Imbalance". We need to see a strong sign of liquidation which comes after the breakout and that heavy selling had some protection area at the as price pause after test the low of those accumulation area and price again went sideways for a day or two and then "Breakout and Test" was good enough to enter and then price rallied strongly to test the highs once again

Saturday, April 26, 2014

Price Reflects Everything


"Technical analysis tells us that "price reflects everything".

Is it right or not? In previous post I've shown moving average indicator as an example of how one can use price-value approach in trading. But this is just example, in reality, simple MA can't show you where value is. Let's say, MA calculates 35 closing prices (35 parameter). Do you think that every price is equal here? Area located at higher prices is more significant for the market because it attracts more volumes (aggressiveness).

So in fact weight of higher prices in calculation formula should be increased if we want to know where value is.

What am I trying to say?

Price can't reflect everything because not every price level is equally important for the market and that is why I firmly believe that support and resistance are temporary profit taking areas and does not reflect a trade location everytime.

The missing piece is time and volume

(we don't have volumes on Forex - tick volumes is not what we need, so we can make conclusions about volumes from price action - was it aggressive or not?)

If you will refer to price as to advertising mechanism, it would be much easier to understand what's going on on the market.

I will quote great trader and coach, Jim Dalton, that teaches his students in approach of auction market principles:

Price advertises opportunity

Time regulates this opportunity

Volume measures success or failure of this opportunity.

Popular Posts