Here ! I’d like to share my ideas on top-down analysis with community. «Top-down» analysis is type of analysis that you do when you watch price action from big picture perspective.
Top-down analysis. Understanding different timeframes
«Top-down analysis» is not a «3-screen» system. Though it may be reasonable to analyze price chart on H1, D1 and W1 simultaneously but that’s not what I do. I use only M30 and D1. By «time-frames» I basically understand not charts but market participants with different perspective. First let’s make brief description on each timframe.
Notice – I’m not talking about retail traders with 100 dollars account, they can not move the market even on a distance of 1 pip, even if they will bring 10000 positions simultaneously in one direction.
I will be rather talking about interbank dealers, some of them will also act like day-traders – most of day time-frame traders will have no position until market close.
Domination
Core concept is that inside one period of time market is driven by certain market forces – either day-traders, short-term traders or institutional demand/supply. If market is dominated by day-traders, opportunity will be pretty limited. However, if market will be driven by institutional players, trend will be able to continue (market is supported by higher time-frame)
Now let’s try to make classification of major market participants.
Day-traders
Professional day time-frame trader are usually market makers – in other words they tend to work near levels that accumulate enough volumes and avoid trading outside the range of the day. Reference points for them: previous day’s high and previous day’s low.
If you see that market goes exactly to previous day’s low and high, probably market is dominated by this group. It means that price action will have limited ability to go further in this case. Unless there are any clues for other time-frame trader (OTF), opportunity will remain to be limited.
Other-time-frame-traders !
Auction market theory has excellent word describing market participant that has perspective at least more than 1 day – «other timeframe trader». We don’t care whether market is driven by short-term swing trader or position trader from hedge fund – we assume that they have enough capital to move price and have some different perspective – what seems expensive for daytrader, maybe cheap for them. They even may not have charts – they make decision using other principles and criterias.
Stop running
Stop running process can be indication of OTF presence. Forex market has huge turnover and liquidity but positions of market participants are also huge – that’s why they often don’t have enough liquidity near certain price level to accumulate position. Remember – they don’t have brokers and buy/sell button. They have to deal with real interbank liquidity and accumulate position piece-by-piece.
If you see stop running in whatever direction, it may be indication of large OTF accumulating long/short.
Reference points
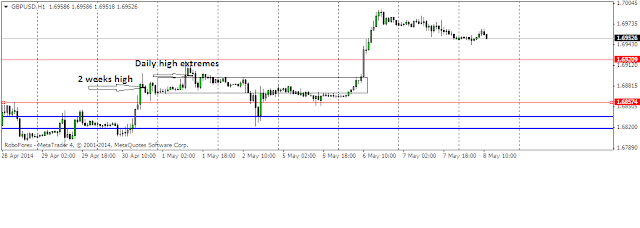
If you see that price is breaking out consistently weekly or monthly extremes (as well as 2-day or 3-day extremes), it can be indication that this instrument is «in play». We don’t know final destination though – it can be either short or long accumulation, we should remain flexible about destination.
That’s example of build up on Gbp/usd.

1. Price is breaking out previous days’ high (and possible executes stops of short sellers)
2. Price is breaking out high from (2 weeks high)
3. Price is breaking out previous week’ high.
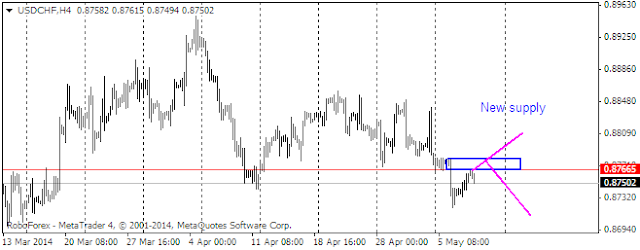
This instrument is «in play». But what to expect? We can expect rapid movement in whatever direction. I personally was trading to the long side on violation of rotational center. But I failed to reverse this position though I had to – final destination was not defined. Nice move to the downside followed.


