Thursday, July 31, 2014

Price did not find any support from different timeframes

Shift in value after no support bounce

Hi traders, Now I am about to discuss few points about when "Price did not find any support from different timeframes" in recent strong move bounce from the low. In forex trading it is necessary to watch logic and remain conscious is the next thing to do. We might see strong trend up or down but relavant information is not necessary in forex trading to enter or exit

Different Forex Strategies points to different price behaviour

Different Forex Strategies tells us that what candles and indicators are doing with current Strong or rangebound trading.

But when You see immediate bounce when there is new low or new high that reverse the price, then it is known as No support show from other timeframes and the bounce might countinue lift price specially if there is shift in value immediately.

Recently I have supported such activity in Eur/cad Chart

Following the explanation of above mentioned comments, I am posting a recent updated chart of eur/cad when we spot such activity and there could lot more to come ahead of Canadian GDP data which is due to release today, So If you are good enough to spot another low risk entry then this chart can fetch some good profits.

Thursday, July 24, 2014

Questionnaire asked by a trade
Most Important things to know
Frequently ask question

Proper questions for traders Hi traders. Our development in trading depends on what questions do we ask. What do I mean by that? The better questions we ask in our learning, the better answers we will get. I work with traders educating them for about more than 3 years now. I and will say to you, that most traders ask wrong questions. In this article I want to make a top-list of most popular questions that should be rephrase to give trader a chance to succeed.

Bad Question: How much will I earn with trading?

This question is very understandable, because every trader comes to the market to earn money after all. But this questions assumes that profit in trading is guaranteed. In fact, it’s much harder to survive in the long run than to earn in short-term perspective.

Every trader can pick good trade from time to time, but there are too many factors that keep trader away from moving forward. It can be either psychological factors or market understanding, but statistics is merciless – around 70% of trades (and in fact, even more) lose money in the long run.

I hear many times from traders what I call «10% mantra». They say – «I can earn 10% a month safely, if I try to make 20-30% it will be risky». It is far from true. So, question that sounds like «how much money will I earn with trading» is equal to «how many tigers will I kill hunting in jungle»? When task of survival is not achieved, talking about profits makes no sense. First trader needs to take protective actions – develop proper money management, loss limits, adequate market understanding. And when he learns how not to lose his capital, it will be fair to talk about profits. The only group of traders that can be motivated by profits, is expert traders.

Only after you can learn to protect your capital, you can estimate the potential for profit (and it can vary upon market conditions, accepted risk and other parameters)

Proper question: How can I preserve my capital and survive the learning curve?

Bad question: Where will the price go?

Another question that is not very useful for trader – «Where will the price go?» (What to expect from the market). You know, many would like to know what will happen. But studies have shown that behavior of price can not be predicted accurately. Best traders are ok to have no more than 50% of winning trades (yet their profitable trades bring more than losing ones).

The game of prediction has nothing to do with real trading. It’s been proven by statistics that predictions have no correlations with real events in a long run. What about analysts? They have to create content every day, they can’t afford to issue one article a month or less (when they see really good opportunity). But trader has no such obligations. We can trade any time we want and we’d better choose the best of market can offer.

The best question you can ask is not «where the price will go», but rather «where is trade location with low initial risk for my trade?». Focusing on predicting makes you concentrate on something you can’t control. All we can control in trading is our risk. Tool for managing risks are: Market analysis, trade location (reasonable level for placing your stop) and money management. As you see, market analysis is not the most dominant part in this triad, it is just «one leg of a stool», no more.

It is important to have expectations about possible market movements, but it is more important to know your trade location – in other words, to know how exactly are you going to play this scenario.

Not being right is important, but earning more when you are right and losing less when you are wrong. It’s realistic. It’s achievable.

Proper question: How can I reduce risk in my trade and maximize return?

Nothing new about it, huh?

But it’s our human nature – we want to eliminate uncertainty, we want to know the future, therefore we focus on what we can’t control. Can we expect to have different statistics (70% traders or more lose their capitals entirely) having such beliefs?

But you can be different. You can be a winning trader.

Logic repeats and Trend Continues After Candlestick Trap

Best way to trade breakouts is conscious Approach

I posted in my previous post that Logic often works and trend continues when we see a candlestick trap, and That is what has really happen in recent Eur/nzd rally as we have seen On Monday morning when price open with gap, and With a strong 50 pips gap in the "context" is too elongated.

After two day activity price went from one extreme to another and when this type of activity happen the market often do this type of pattern with again the trend strong breakouts and price reverse from the low of that correction ends.

Logic and consciousness is required to trade the recent setup in Eur/nzd

The Idea is if we look into overall context then we must remember that Idea to go short here prior to a high risk event has No logic as price does often can spike and continue rising and entry was offered at 1.5610 area and With strong candle from the lows it is almost impossible to calculate the stops. So, We should be conscious enough to buy with bearish breakout low and stops should be tight as In this case

Monday, July 21, 2014

Profit taking at supply area as It holds In eur/nzd

Profit taking in Eur/nzd

First take a look the post Which I posted This weekend click here

Price opened up with a big downside gap which was quite elongated in this type of scenario and should be ignored in overall context. But the most important part was that price found strong momentum off the lows when it test the breakout area or Minor development area (which was same in this case) as it rarely happens . There was long sideways movement for a complete day but it protect the earlier lows which is a good sign of price finally test the supply at 1.5694.

Take a look at the updated chart of Eur/nzd

Price Action trading,Forex Books, Price hit the supply, Intraday technical outlook, Intra-day updates,Missing piece of price logic,Forex forums

While we built any Forex trading system Or read any Forex books or even look out for Forex forums, the Most Important part is missing piece of logic. While driving a trade or carrying forward a confidence One should be aware of all these logical facts which drives the market and We should be quick to get in and get out if situation opposes. And that is why Price Action Trading has an edge over Any mechanical systems using Bollinger bands, RSI or Any other advance level of Indicators.

Saturday, July 19, 2014

Education Forex Trading for begineers Price action Supply And Demand Im...


Price Action Basics How to scan the whole actiivty.

How to scan the whole activity

Forex Intra-day strategies Should Include enough logic that you can scan multi pairs at a given time, because it gives you the idea to trade Forex According to your strengths and scanning multiple Pairs gives you that benefit.

In my View If you trade only few pairs then you try to force the issues to enter forcefully when there is not even a single clue of what is happening and Outlook seems to be Neutral According you Trading Plan.

See the Gbp/cad Chart Scanning Friday Activity

 photo GBPCADH1_zps1da8b90f.png

The chart of Gbp/cad tells us that When we have primary breakouts then we should look for Price Behavior as I have mentioned in my earlier post. I strongly believe when after breakout price consolidates for much longer time then it means the price has fade out the momentum and that is a type of activity that is happening in Currencies market to trap traders.

But after we see minor development and when it is tested it found more "aggressive volumes" and we see violation and another breakout, then it give us hint that in future there is a big chance that this area will be protect (If it is tested) as background tells us enough accumulation and then buying could be distributed in whole trading range which could be the case.

when price test that area we found strong "demand" and We need to be quick to enter and should be aware "How to cover quickly" with small loss if momentum fade out again but chance of probability that such trade will succeed is more than 50% which should be good enough for a trader to enter as compare to low probability or use of any mechanical system.

Primary Breakout with Minor development Area

Minor Development Area And Hotspot areas

As, I have mentioned in my posts that we should be looking to trade primary breakouts and See If that Breakout will succeed or will fade out the price action. When we line trade for Intraday technicals then this type of forex strategies you should be rely upon that have real logic. we should depend on clues when we see such behavior Like the "Passive Behavior of Sellers After Breakout", "Minor Development Area", "Rotation Center Violation" and neutral days after breakout as these are good clues that whether strong buyers are behind the breakout of it just a retail trader activity.

 photo EURNZDH1_zps90e06e27.png

One thing I always relies on when price behave after testing the Minor development area and It has built some reference point on neutral days, But activity should happened within the next day or two otherwise we could soon see market Liquidate. Chart above is the example of Eur/nzd pair when market has made a primary breakout and we should rely on such trade locations after such activity has happened.

Now If that breakout is not made by strong holders then it will liquidate or Reverse pretty soon But I have strong clues that market will unlikely revisit that Minor development area Or If it did then it will find more buyers and They mark the price again up and trend will resume.

So,the idea post such charts that When we develop as a trader and Start learning everything that drive the market then we should always look to have such Intraday or Swing trading strategies that have logic and reasons to enter or exit should be strong rather than Looking for Indicators to give you clues above "Overbought" or "Oversold" conditions or "Divergence" Which Hardly helps to grow you confidence and profits

Wednesday, July 16, 2014

Canadia dollar Trade locations with possible Outcomes Outllook strogly bullish

I posted on Friday that 'Reversal' in trend of Canadian dollar is on the cards and According to my Forex Intraday Trading strategies I would like to remain bullish on the pair. After I posted, Price break the point of equilibrium straight away and Now I am posting two charts with two possible outcomes. With BOC not a lot concerned about the 'BOC Policy Decision', and they are ready to enjoy its weakness for Growth and Recovery.

Take a look at the Chart of Canadian Dollar Hourly Chart

"

Tuesday, July 15, 2014

Forex trading Price action based on supply and demand Levels

How to trade basics of price action

As Long as charts are not Uploading on my blogs, I have used My youtube channel to let you explain the reason of entry and exit and that video was posted on my Youtube channel yesterday and It has behave the same way which I have anticipated.

Gold Updates As we have some strong accumulation

Gold Comex Updates

I would like to update the Gold chart as I have seen some "Strong accumulation" before the next move. In Forex trading "Momentum can reverse the trend but Only In Forex we have some strong supply and demand Scenarios which makes this place full of opportunities. My "Intraday Forex trading strategies" always tell me what I am doing and Why I am making such Observations. If you have strong downside rallies ahead of strong "Protection Area", then need to have first clue of price holding downside pressure.

In this case we have some strong protection area after the breakout(upside) around 1298.00 and After price manage to hold the higher price so strongly for few days It build up some strong "Reference Points" Marked by blue rectangle and the upside rally sustained after the test of "Accumulation Zone", the price has again start reacting at lows and also holding further downside rallies.

I would rather recommend and test of lows of failed with strong momentum coming in again and we have only one supply zone which is around "1321" and then "1336". Risk is not that much when we see any momentum coming but reward is very good and that what should be the case while we trade any currency or metal to offer you strong reward and low risk

Take a look at the updated gold Chart

 photo XAUUSDH1_zps70168ee0.png

In this chart shaded blue rectangles are the trade locations which strongly hints about the test of atleast supply zone on Intra-day basis and Price is still in range after the strong downside rally yesterday and I would recommend you to see whether we see strong breakout and test of the range and continuation of "Uptrend".

Friday, July 11, 2014

Candadian Dollar spike of daily Demand Zone Outlook Bullish

In elongated trends Value does shift several times

Canadian Dollar spike from the several months low was due to strong demand area as it was the are just above the protection area which is 1.0560. Risk aversion hit the market when Canadian Banks released their monthly Unemployment Data, which tells that unemployment rise during last month and rate went upto 7.1% as market was anticipating no change.

For me It is a strong hint that market has complete the correction or it could be reracement as well but In elongated trends, this type of behavior is very much on the cards and Price go through the 1.0680 supply zone with conviction and strength.

I would really try to take a closer look if that "Supply Zone" is tested again and this cross will be on the priority list to trade.

Take a look at usd/cad Daily Chart below

usd/cad technical update,Intraday updates, gbp using outlook still bullish, buy on dips.

usd/cad Bounce of strong demand zone Outlook strong bullish

IN this chart there is strong elongated trend followed by strong liquidation but as I mentioned in the blue line which is just above the low of breakout out candle which comes in at 1.0560 "protection Area" and when earlier spike was way above that area and created a strong demand, We should have the clue "How to trade" such scenario when that area is tested again.

I did enter after strong momentum candle spike off the lows and It could be a start of new trend again and that is why always trust and momentum and take one pair at a time specially when it One Time Frame Move (OTF)

Thursday, July 10, 2014

Gold Intraday Technical update Rise from strong Demand Area

Protection area in technical analysis when there is a breakout

Gold "Rise from Strong Demand Areas" And When we see movement that is going to be highly volatile and starting from inside of the trading range, it’s probably a «cascading effect» - something that is created by «fear of missing out» - many traders are chasing this movement and will lead to fast auction, raising prices higher and higher. In auction market theory it’s called "initiative break", it means that something is happening very quickly, with significant expansion in volatility, and maybe – volumes. But volumes can be not interpreted easily in this case.

When volume is increasing (or decreasing) inside of the trading range, this information can be misleading, because there are too many types of traders participating inside of the trading range – from algos to scalpers, and increased volume can be a result of those guys’ Overtrading

Gold Intraday Update as it has In strong run since low

gbp/usd technical update,Intraday updates, gbp using outlook still bullish, buy on dips.

Gold Intraday Update Cascading Effect

The idea of posting such is good from Educational point of view and also such activities can get more out of you as a traders because It does make sense to trade logic things and trade what we see rather than what we expect.

Analyzing too many chart at a Time does necessarily means that you are trying to force the issues and try to capture every possible opportunity that can arrive at any time.

But things are different with "Commodities" traders that you don't have to be worried about anything else as there are two or three precious metal to remain focus as compare to "Scan" Multiple "Currencies", Which is impossible.

Wednesday, July 09, 2014

Supply hit the market Update Australian dollar

Supply has the market in Australian dollar

AS I mentioned yesterday that we have got another trade location in Australian dollar around 0.9405 Area and that was strong "Violation of rotation center" After "Accumulation", Entry was offered around 0.9410 and I was looking to take my profit around 0.9440-50 area, And After the release of "Australian Employment Report", which was mixed with Unemployment rate rise after decent People were Employed and Market was all set to test the Supply and that area was good enough for us to book the profit as price come back to opening levels of the day.

Updated chart of Australian Dollar

Australian dollar update, Release of Employment report of Australian, Price hit the supply in cross Aud/usd , Chance of reversals in Australian dollar, Technical Updates of Australian dollar , Forex update of Majors

According to my Analysis I always look to find pairs which are trending and have logic to reach or test certain supply demand zone as Price already priced up to behave in such manner.

That is the reason I never look for reversals too early Untill there is clear evidence that trend is mature and look to reverse or correct the earlier trend.

But Australian dollar has spend so much time near the highs, this and got rejected at the trend extremes It will probably correct deeper or reverse, So Now I have maintain my neutral Bias on the pair untill Price take the Highs with conviction and convince me to enter again.

Reason and Logic of trading supply and demand

Logical trading and Importance of context

As I have always mentioned in my previous posts that When you trade Forex currencies then there is strong conviction should be seen in your trades and Most important one in "technical analysis" is trade with logic. "Supply and demand" works together in forex market as there is strong demand coming out on previous reference points and specially when that area is protected.

Few days back I mention that I am long Australian dollar and I have few reasons for that Please check my previous post of Australian dollar here

Check the updated chart of Australian Dollar

Price has reacted the same way as I have mentioned in my earlier post,as that Particular area was strong "Confluence" and price holds the higher prices after breakout as well .

When you have such scenarios, then price usually Gravitates to test the high or the supply areas(In strong or elongated trends), as It has done in that case. Strong selling followed by "accumulation", always tells us the reason why the price has paused and start going sideways and that should be good enough to give us second thought before we go short in such cases.

Specially If there is a breakout and traders often trapped by strong selling and start selling the rallies but logical trading tells you to wait and see before fading such breakouts And If demand level is already protected, then we should trade rotation center violations of false breakout after the daily range breakout to the opposite side.(Also Known as Responsive Breaks)

It is important that you know you strengths and weakness.

Important to know your strengths and weakness

Have you thought about this thing – do you consciously understand what is your best niche in trading?

We are all different people. We process information in different ways. The only way to sustain ongoing learning process is to find trading niche that suits your personality.

They say – talent is the key for success. I would say – the key to success is «talent + environment».

To become master trader, you need to process huge amount of information, master all nuances and details of price action before you obtain intuitive skills. This is hard work, but it absolutely doesn’t feel like work if you’re doing something interesting and emotionally rewarding. This occurs when your natural abilities to process information are involved. Our learning curve accelerates significantly if we are operating inside our niche.

I will share with you small check-list that will help you better understand what your trading niche is.

Consider answering simple questions

Do I make tend to make decisions by analyzing data or by «gut feel»?

It’s not even about decision making process in trading, it’s about life in whole. For example, how you decide – what car or computer to purchase? Do you patiently explore feedback from some special internet resources? Or you just follow your impulse and pick what you «feel» is good?

It’s nothing wrong about that. This is how we process information and each of us has dominating style of perception as well as reaction to outside information.

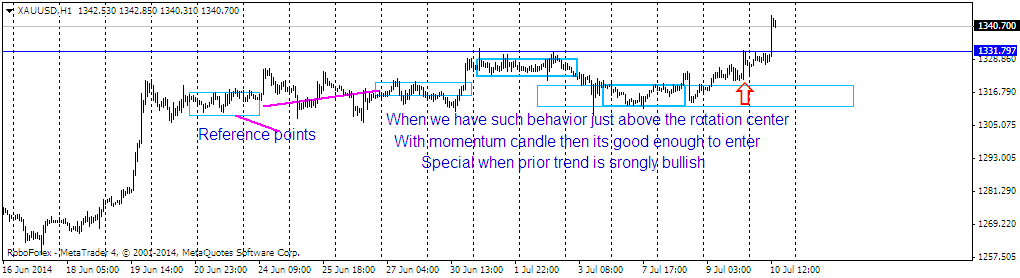
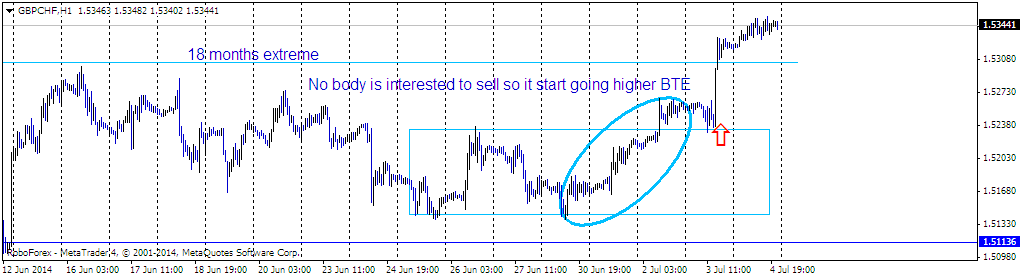
In trading, «gut feelers» will be better at pattern recognition. Price action trading is not a science - from time to time, market creates short-term imbalances and elusive opportunities that can’t be recognized by traditional technical analysis – there’s no way to measure «aggressiveness» of the market or «lack of conviction». Yet people with strong gut feel and intuition can read price action quite effectively. Their learning curve accelerates when they start master some patterns and setups observing nuances and details of limited number of setups.

You can hear from this type of trader: «Here market is strong, here market is weak» - that’s how they view things, they will not be able to explain it. «It’s just obvious» - you will hear from them, after you will ask them to explain their best trades.

Other traders will need research and solid rationale beyond their trading decisions. They will be more capable to deal with building trading systems, measuring and optimizing parameters, dealing with statistics and so on.

For example, I tend to be more «gut feeler» (though I have solid trading approach, once (several years ago) I was trying to master some «mechanical trading systems» under supervision of experienced trader. It was a complete disaster, I’ve done a lot of mistakes, was emotionally sucked out and lost significant amount of money.

It was tough lesson for me – I had to switch back to my preferred trading style and master it. Then, things have become fine.

Tuesday, July 08, 2014

Are candlestick alone reliable for pullback entries ?

How candlesticks patterns trap traders

How Candlesticks trap traders,Why candlesticks alone are not reliable, Candlesticks Trap action, Candlesticks don't help in long term

Trader relaize Length of Candles were not big enough

Why I always think that candlesticks are the least important things in considering pattern outlook. I have heard from lot of newbies and experienced traders that candlesticks "Price action" is the best way to trade, But for me it has the least important factor in determining the trend outlook.

When traders saw strong Momentum against the trend,Then traders quickly start observing that it is the end of the trend and Price is reversing, But smart money never react that way, they rely on liquidation to reverse the trend, or to continue as they always try to accumulate their orders and always look to buy low again and stat building on their position slowly.

Same thing has happened in bearish reversals as they always give you better low price to enter and Traders realize that we are getting another chance to buy the Inventory at low prices, And bang they sell with even more forces and that is what has happened in the chart mentioned above.

Monday, July 07, 2014

Australian dollar another demand level could be eyed

Another opportunity might be on the cards for Australian dollar

I have taken a closer look on the cross last weekend, and waiting for demand level in Australian Dollar which could be eyed by Strong buyers, But the reason I am not too much eager about the setup is that due to strong selling pressure from multi month high.

But as I have mentioned I always look for setups that give clear indication of continuation and In this pair there is one on the cards offering pullback.

In the chart, I have seen some strong reference points which holds the highs and higher highs were posted and strong liquidation which has not yet picked up momentum,but it could be a part of extended accumulation. Strong points are :-

1. Price has strong protection area mentioned by blue line

2. Price close the week on lows at demand area

3. Price holding the demand level after strong selling which could be a part of strong accumulation.

Take a look at the chart below

All the traders who trade technicals and contribute a lot and achieved a lot and have confidence that setup has strong logic and reason to enter and exit. And same thing has happened here for me, as there is no strong supply but a little one around 0.9440-50 area which was previous top and stops could be place around 0.9330 in case any whispaw that will protect the entry .

Friday, July 04, 2014

Gbp/chf Breaks the equilbrium and momentum was again shifted

Trade what you see don't what you expect gbp/chf technical update,Intraday updates, final auction strong technical reason outlook still bullish, buy on dips.

gbp/chf strong push to the upside after strong consolidation Intraday update

For those who did not see my earlier post take a look at here

First thing we do when we see a chart is to see what is the main trend, and when we have some strong background not too historic one but has happened just recently, and price start moving in the direction of the main, we start observing that whether or not the resistance o support will hold.

But when we see that type of chart where swing from low is strong and corrections are getting smaller, then we should wait for the final push and test and that is what happened in the cross and I was first to point out that franc weakness against strong pound is imminent and my doubt became more evident when price break the 18 months extreme and weekly and daily extreme on hourly chart.

Most important thing we do before we pick any particular chart is that what is the main trend and whether or not imbalance is still present in the market and the answer is yes, Imabalance is still present in the market .

When we see strong swing and price behave with low tempo when it start correcting then we need to just pick that type of chart and start looking for trade locations which was offered with the strong push through previous "consolidation range", and then price test and then spike was so strong it gone through all the barriers and in no time it climbed up more than hundred pips.

Are we seeing continuation of downtrend in Euro !

Trend continuation after correctional bottom.

Are we seeing "Trend continuation to the downside Rally", Are we really seeing another attempt to downside for the Euro, And if I am correct, Then soon we will see the test of correctional bottom.

Downtrend continuation confirmation, rising attempts have been failed

The idea I post earlier was that We have seen rapid liquidation after strong trend which means at-least one attempt to test the high and Very often price gravitates to the upside.

when we see such attempts, But all the attempts have been faded out and Now we will soon see another low in the trend.

In order to invalidate this Rally, we will have to break above 1.3695 and see an attempt to rise once again. But current rally and attempt to rise have been failed so far and the outcome is test of lows and possibly new low.

Thursday, July 03, 2014

How much importance does context have In GOld Rally

Gold weak buyers breakout or correction

Gold rally from lows is very strong and It has stalled and spent so much time near these areas, In order to point that strong holders are in dominance one should look to spent time near highs but breakout and shift in momenutum has nothing to do this time.

May be strong holders left the rally around this areas and recent breakout has been done by weak or small position traders and IF that is correct, we should soon see strong liquidation today or days to come.

I would bet on that sell-off today because of lot of high Impact News, First ECB rate decision and then "Non Farm Payrolls".

In the chart below I have pointed whether the recent breakout has been hold by "Strong holders", and if that the case they won't let sellers to get hold and will keep moving the price higher immediately after the Momentum fades out by price again breaking below the upper boundary of "Blue rectangle".

False breakouts, reversals pattern, logical trading, reading overall context in gold chart

Gold Chart Possible false breakout followed by reversal

Simple rules when price spent so much time near highs then it works as double edge swords that whether strong holders are no longer interested, then it is overtaken by small holders and they continue to buy on dips and make a breakout but then immediately strong holders make their presence and create massive liquidation and that could be the case here as well in Gold chart.

Wednesday, July 02, 2014

Support resistance Trade Locations and Then Final Auction

Final Auctions always do tend to move the value higher immmediately

As clear from title, I am talking about "Support resistance" (short term barriers as there are no terms associated with S/R In my trading)"Trade Locations" and "Final Auctions". These Terms are know to every Forex trader but How Important role they play in developing a successful trading career.

Nobody knows this answer, As these terms are incomplete without each other and When you trade any strong supply and demand market you will have to take them all together and then think about making consistent money.

I mean to say when a trend is maintained throughout and became an elongated trend and you find some sideways movement and then downside take momentum but it is faded out immediately, That means that imbalance is still there in the market and It will offer entry at good price.

Take a look at the follow chart of gbp/chf

Pair is in strong elongated trend, amid strong "Great Britain Pound" Across the board.

 market break all the barriers, strong push to the upside after consolidation, chances of price to resume its trend shortly

gbp/chf FInal push Break the equilibrium and all the barriers.

AS I have stated in my posts, there are strong convictions that when you approach that type of trading methods , the chances are that you might fail to understand the momentum when it hits the market, But the truth fact is that trend is often part of imbalance and till the time, price does not break the floor with strong downside candles, the chances are very big that trend will continue after "accumulation" end and distribution phase started.

Tuesday, July 01, 2014

New Updates based on recent price activity.

Technical updates

I have scanned the market activity of recent week (as I never rely on price action too historic) And I have seen some missed and some good opportunities.

Trends often occur when there are not enough traders involved and market has to advertise more and more to attract liquidity. So, big market participants are often not interested in trends, they would rather prefer balanced state of market to have opportunity to slowly accumulate their positions. It’s tough job – to accumulate position on the rising market.

But as we have seen most of the time they accumulate the price before finally advertising it higher, and gbp/cad recent example I have sighted on the chart and Entry and exit are mentioned on the charts given below

Take a look at update chart, Bit complicate to understand but not for those who have regularly visit my blog for updates

Trading conviction, real time forex trading updates, Gbp crosses in strong momentum and outlook is still strongly bullish

There is strong trade location building, which tells us that another spike and trading opportunity can arrive anytime soon, and We should not use higher stops to trade that opportunity and that is what smaller risk and strong rewards is known for.

Popular Posts