It is very important to know that what is important in predicting overall trend , Is it pattern (candlesticks or chart ) or it is the logic behind the continuation or reversals.
For me, the candlesticks or any other chart pattern or any indicator combination tells you only the 10% of the whole trend, and that statement is very disappointing because even good pattern fails and you seems to look out for reversals too early untill it happens, and you avoid those timing because of earlier stops-outs.
Context can tell you what to look out for in patterns
Context can be anything and it could be correction bottom, yearly or daily extremes and weekly extremes breakout and consolidation area at the top after breakout and you need to be extra pro-active to see what price is doing after breaking out from a level. IF price has risen from a range and reverse immediate then it is said to be neutral behavior , and it could be the case of market expecting something from fundamentals, and you can never get any entry from these type of breakouts or look for confluence areas when such activity happens.
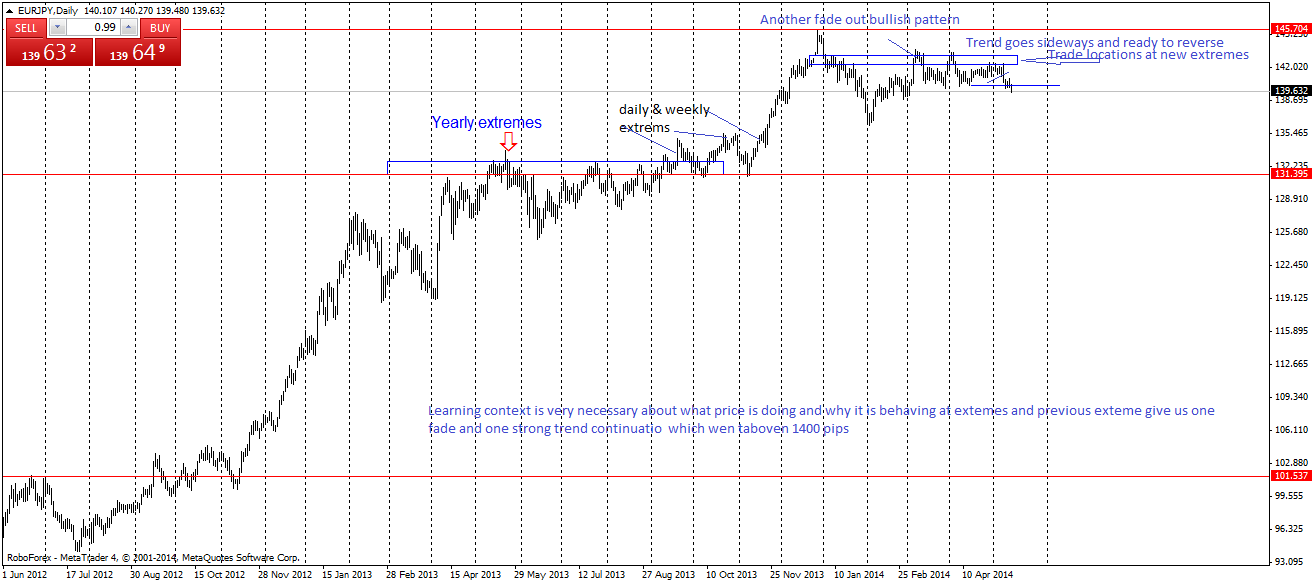
Below is eur/jpy daily chart in which I have emphasis on context
In this chart, the most important thing, is price making higher highs and holding on to those highs as well, and the conclusion one should not look for any short trade or reversals till market consolidates on large scale at top (lot of consolidation at the top area is also a strong point For reversal)Previous high was yearly extreme, and market consolidates and give one breakout of a range pattern, which was strong one ans was faded out, but there we never get any strong liquidation which means that price can rise of from the low and this could be a swift move, and that exactly happen with a large breakout and test of that breakout.
Now we have seen the new price extreme and multi-year high and that high has been holding further development of price and price is in range after strong down movement and After going sideways price has managed to give strong breakouts of the range at top which faded out earlier, but support is holding . After strong tests price has manage to fall swiftly of that trap of strong above the high reversal pattern, and that type of patterns reverse the price most of the time and even this time price has faltered again and fall more than 300 pips.
Check the chart below !
So, the idea to post the above chart is not to derail anybody or discourage anybody from whatever he or she might be adopting, to predict the price action, but to tell you the most important point that is missing in your trading, i.e logic and when you know the logic behind the trading you can have few losses and that would be small one but your profit factor would be huge and you will how to ride the most part of the trend.
No comments:
Post a Comment