Tuesday, June 10, 2014

Reference points involvement in predicting next possible move

I have covered "reference points" in my previous post in which I mentioned how we can "pick reference point in predicting the next possible move", as there is always a chance of neutral activities after breakouts, which prevent the strong rallies to the downside.

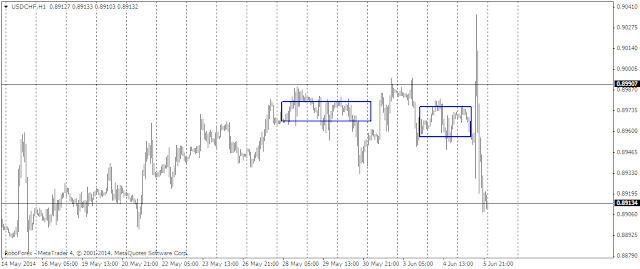
I posted a chart of usd/chf chart on Friday for possible continuation to test the highs after we have some good trade location taking out the "highs".

The chart below is a true indication of institutional activity and when we have some good reference points after breakouts, then strong downside rallies are often "reversed" as In this case.

Recent price action update of usd/chf chart !

Although it is not necessary that we should look for this kind of price action in every strong breakouts because it tends to gravitate to the upside after the end of correction, But the chart which I mentioned above accumulate after that downside rally and strong breakout test was there and that rally pause to take the stops of buyers.

But the important thing is next rally was powerfully to give you second entry and trade location was exactly the low of correction that start from low of bottom.

I have seen some strong buyer is Australian dollar as well will post the chart soon If I got something substantial

Monday, June 09, 2014

Basic convictions of technical analysis

Convictions of Technical analyzing in depth «Price reflects all, trends will likely continue and history repeats itself.»

I would say, it’s true in the first part – price reflects it all, what about 2 other? Will trends continue and will history repeat itself? It’s a big question because nobody knows what «trend» is for example.

Some people draw «trend lines», but more often than not they provide information that is already useless. Trend line shows trend when it is already confirmed, therefore it has lower odds for continuation.

Traders also use support and resistance, but it works only when strong demand or supply drives the market. Those technical methods will not help you identify strong supply and demand – the fact that price has touched some level twice is not the indication of strong demand.

But what is that?

Einstein once said that you can’t solve the problem using mindset that created this problem. To combine information that price gives us, we should apply one more parameter, and this parameter is time.

Of course you are using it in some ways, but traders often don’t use in consciously.

What time gives us?

Time is one of components of value. The more time we have, the more value we can create. Simple example is interest rate. If you put some money in the bank, interest rate multiplied by time will increase your capital.

The same is in trading. The more time market spends near some given level, the more this level is validated.

There are some clues when you employ parameter of time compared to parameter of price.

Corrections are not deep enough.

On screenshot below you see no spikes on the way down:

Trend is likely strong if:

Usually they don’t exceed 25% of previous move up.

It means that strong buyers are probably dominating. To make things clear – by strong buyers I mean «buyers with distant stops», not «buyers with unlimited pockets». But more often than not those who can move the market and yet have distant stops are huge enough, be sure about that.

Why does it work that way? If you see weak buyers involved, they would liquidate quickly and market will go after their stops – you will see rapid «spikes» on the way down.

I will cover more on this topic in the days to come ! Keep Checking for Updates

Thursday, June 05, 2014

Types of Swing trading.

Swing trading and its types update

What is swing trading? How "swing trading" differs from «momentum trading»? Actually, there are many approaches to swing trading, but I will express my point of view on the subject.

Swing trading is trading on intervals more than 1-3 days, some traders may call it «long term» or «medium term», but in fact, good swing trade can last no more than 4-5 days. Swing trades are usually level-based trades.

For example, if you trade momentum, you can capture short-term overbought or oversold condition of the market (imbalance) and trade-off scenario of inventory correction.

Swing trading basic based on rejections and hotspots areas

I basically trade 2 types of swing trades – «rejection trades» and «hot spot trades»

How do they look like?

In this post I will talk about "rejection trades".

Briefly, rejection is a reversal. It’s that simple. But there’s one small nuance. Rejection level is not a «support» or «resistance» level. Actually, there are no support and resistance levels – there are only areas of support and resistance. And they are usually located where majority of traders don’t seek them.

Important principle:

Before ever considering fading correctional move, you should see signs of support/resistance before. Sun Tzu had said: «Every battle is won before it’s ever fought»

The same is in trading. Every reversal is made before it’s occurred. Weird, huh?

Reversal is just a paradigm shift in heads of market participants. Before reversal, market must have strong imbalance between demand and supply, otherwise no power can drive the market against existing trend (even correctional)

So, to decide whether to join a trend or not, you should see signs of big money buyer (seller). As you know, institutional buyer will tend to accumulate, to slowly build his position. More often than not those guys are not speculators in conventional way – they accumulate position by given price, then use purchased asset in business outside the market.

So, if you see that market tends to show you very well traded levels in the center of the day and poorly traded levels on the extremes of the day, it can be a sign of accumulation if this process goes long enough.

Look at the chart of usd/chf – you have seen signs of big buyer accumulating long here – look how price is leaning to the area 0.8970. How do you think – why market shows strange consensus around this level?

Also, you expect to see «neutral» or «normal» days as the process of accumulation goes on. Neutral day is day with very low tempo and aggressiveness – it closes near its open. Normal day is more aggressive day, yet it also closes near its open. These days also help you find accumulation areas on the chart

Usd/chf update

Here is the update

New Usd/chf chart update

As I mention earlier in my post, sometimes it is easy to find reference points rather than mere support and resistance and current rally is a example of that and Price was willing to rally after strong consolidation for days and that is where we should stay alert.

Are we seeing another attempt before ECB decision

usd/chf Intraday update

USD/CHF Intra-day Technical update . Are we seeing another rally

There are some things that mostly day-traders do and rarely (if not never) other time-frame traders do. As an example - reaction on short-term reference points.

Price action indicates - what market does right now, but we need to know not only that, but - what to expect from the market? What can we anticipate?


While we analyze any chart, we first rely on the recent price action and rely on reference points, which are short term location where price lean after break out, Candlesticks chart or support and resistance traps are quite often ( I don't think that there are any such strong and resistance area as there are extremes and rejection areas and it is important for us to know how market react after breakouts)

With candlesticks, I don't trust any patterns as there are often strong breakouts are followed by reversals,Big buyers used Candlesticks against the strong trend to reverse the price for liquidation purpose and to trap the traders who don't know what is "Context" and what market tells you to do after such a candle appears and price did not follow through or pause for few sessions.

Monday, June 02, 2014

usd/jpy strong accumulation period after breakout


usd/jpy Intraday update

usd/jpy Intraday update . Are we looking at culmination ?

The reason I was concerned with this trade, because there are not too many times price has lean near those high prices and downside price action was rejecting from low prices.

To spot «weak holders» activity, let’s think – what levels will be not interesting for big money buyers/sellers?

They are – sessional highs/lows, previous days highs/lows.

We see some participation from level above and price freezes near level below. If it reverses from this point, probably it will be a sign of day-traders purchasing there.

Big money players are not interested in that levels – they don’t attract enough volume for them(Like the one I mentioned where are set my stops), Big money buyer will rather act inside of consolidation, because he needs volume to execute his position. (They rarely react at daily price extremes) Now if you have two attempts from day-traders to play long and to play short, you may want to see – what group is going to earn money.

If sellers will have good prices to exit (prices will breakout to the downside quickly), then probably market is driven more by strong (professional) supply there, if day-trading buyers will win, then some strong (professional) demand is there and helps them.

Usd/chf real time update.


usd franc real time update based on Intraday chart !

As I mentioned in my previous posts that trading is advertising mechanism and we have seen this in the pair when Institutional money is continously buying at low levels, For those who did not follow my previous post check it here !

Price action does give us hints of buying

In this chart we have seen some strong trend breakouts and recent breakout we have two scenarios, One price after second breakout was holding higher prices and when we have few neutral activity days and if that strong holders, which it was, will test the low and shift in value and then they start buying again with even more force.

If Our assumption is correct price will break the barrier and will make a new high and that should not enough as we would start covering our position if we see any such activity.

Demand and supply are very crucial aspect of trading and when price is in strong swing it gives us an entry to renter at pullback but we must consider a thought that why such entry is offered, and any logic behind offering such entry.

When we have good solid background which tell us that buying activity was there even while correction and any such area which has hold before could be a good clue of price will advertise higher again and even with strong force that it was done earlier,

Popular Posts