Thursday, April 17, 2014

Australian dollar and Newzealand dollar Short Scalps in Range Bound Trading


new zealand dollar price action update

Little update on downtrend resumption as I was eager for that trade and emphasis a lot on this setup for the past two days. Take a look at the chart and decide what one could have done wrong when someone is aware of "distribution". Take a look at the update chart below !

scalp opportunity of kiwi dollar as imbalance disappears in strong trend

As I mentioned in my previous post about imbalance and difference between short term scalps and swing trading offer lot of opportunities as mentioned in Post. Check it my last post Here !!

Short term momentum does give us lot of opportunity as we are told from start that we should trade what we see. Here I go short with the trading range as price action in ranges are quite repitative and when we dont find enough buyers in short term picture then price keep looking to strong demand areas to find how crowd reacts there.

Here is I have mentioned that longs were trap with strong range breakouts with bullish engulfing and price test the area and immediate covering was found and lot of downside momentum as well.


Here is the another classic example of buyers finally give away in range-bound trading and price finally repeat the price action again and range breakouts again to the upside and then again after find strong short term buyers sellers again step in and move the price to the downside again to the support 0.9340
Check it here!!


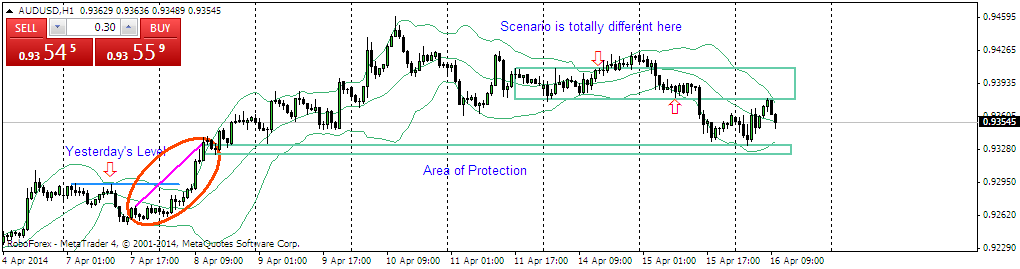
When suppliers can't move the price immediately specially because of strong uptrend then they will liquidate their position with strong bullish engulfing bar to sell from better price and Australian dollar move today was a perfect example of today, although second trap was much more valid as first was overlapped but idea was too sell with a strong bulk orders.

Take a look at the chart below !!


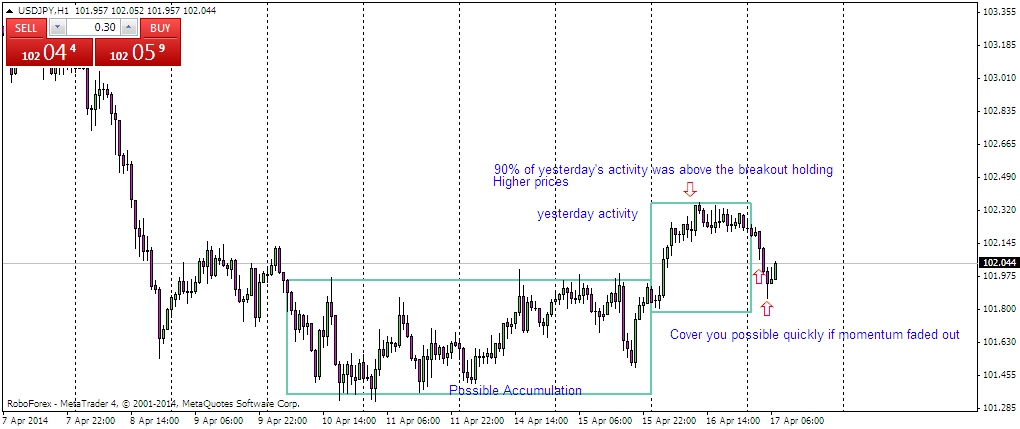
Momentum give you another entry to enter again as I mentioned in my previous post that we need to cover but next candle break above that faded out candle.


Take a look at the chart I posted first on the blog, Here I mentioned that price has spend 90% of the range to the upside, yesterday and when it happens and market is moving down slowly and certainly it find strong momentum from the previous day "Minor development Area", then we get a good high risk reward oppotunity to enter on momentum as I did here and I had to cover with only 12 pips.

Take a look at the chart !

As I have mentioned in my previous chart we should cover over position with strong momentum candle which was faded out and another bar could let you enter again as there are best chances of momentum to carry throughout the day as it did.

Take a look at the chart Below !!


Wednesday, April 16, 2014

usd/chf intraday Update short term reversal could be here.


Are we seeing the short term reversal in dollar franc currency pair or it could totally reverse the trend ?

When we see such activity when price react the same way as thought and then suddenly we have seen some momentum candle then market won't go down immediately. It will try and create panic and will absorb buy orders at some place and Now i am eyeing if price absorb buy orders as it has already taken the stops of longs and now it will try and create panic with some upside momentum and then continue down to challenge 0.8750 support

It could not react the way I am looking for, But certainly a very good opportunity for short term trader to make some good profits and learn as well for the future reference.

Usd/jpy daily Technical update


This is know as 50-50% probability. and the outcome has logic behind this

When we trade currencies, there is lot of people and banks watching daily activity not for entry purpose, but in order to absorb supply and put in orders and that is known as natural behavior as no-one knows what price will do.! Price spent most of the time above accumulation breakout area and then holding higher prices in U.s session yesterday and that was one the cards that down movement will be bought if it happens immediately in the first session.


Little update from usd/jpy longs,momentum was here but Now we have to cover the position because momentum is really fading out and loosing steam. Have a look at the chart below. !!

Now price has got momentum and confirmation candle which is also strong, so I will prefer enter this type of scenarios which have logic and suits a trading style which tell you to cover quickly if momentum fades out, rather than setting predetermined stop levels.

Time to update usd/jpy daily activity after covering you can close the trade now with good 40 pips profit were risk was only 5 to 10 pips because you can't risk more than that when you decide to cover !!

Trading is much more than just buy and sell and it really is about logic


Truth behind trading is that it not a "science". When someone offering free services then it does not mean that we should not use our skill to know the fact and there has to be logic behind it . Interpreting charts can be not very complicated, and I would say – good setups look pretty simple, but in most cases this simplicity requires eagle's eye and some practice like the one below !!


For my style of trading I have no room for reversals which may or may not happen at all and I try to spot the reversal too early and if it does not happen and price respecting the line of defense also know as "Area of Protection or Minor Development Area" i.e when we saw a strong momentum breakouts and price build in some area where it spike few times or may be twice and then it could be rank as minor development area and it could be inside a bracket or rotation center and any test or strong demand would surely means strong holders win the last day in range bound trading and today again they are ready for ride .

Let me give you simple example by chart ! Its Usd/cad chart which tells you exactly what happen as it was decided earlier what was one the cards prior to BOC policy decision.

Short term trading bias is very important for daily technical analysis purpose


Short term perspective is very important aspect of building a career, In trading words it is known as "Versatility"!

How much importance do we consider to give our bias whether it is performance or whether it is "Directional". Aren't, we thinking of too far ahead and giving away short term profits away with that mindset. Let me tell you giving importance to short term profit strategies giving you much more to earn while momentum is there rather than looking for consolidation patterns like "Triangles" or any other "Chart Patterns".


Market makers hardly look at charts and they look at the chart only to see what crowd is thinking means what bunch of new traders do when there was no big market participation by them. So, It became equally Important to look out for strong "breakouts" and neutral days after strong activity happens on an Intra-day basis, while the overall price action is opposite of that day activity say, Reversal is happening on short Term prospective.

By the way, crowd doesn't necessarily mean lack of money on deposit. It only means that horizon of a trader is relatively small. In most cases, it’s short term traders who are responsible for initiative and liquidation breaks, because they are willing to buy and sell on support and resistance with fibonacci involvement

Value Need to move with price because all support and resistance levels are not important for market participants


What is value in real Terms? Value could be anywhere between a chart. It could be intermediate bracket or the area where price spends most of the day range but it changes all the time, You can see Price consolidation in range in European session and breakout and see another range in American, So that time value has been shifted higher And most of the times when you see such behaviors then there could be liquidation with strong rejections could be the entry points with small risk.

Day activity should be kept in mind and traders look to apply indicators to see value and substitutes are MA or Bollinger Bands, But for me it is only "Prior Behavior" and context which sets values below is the example where you will see that according to bollinger bands applied traders should be selling but if you look at the range price show momentum and after liquidation it keep going higher and value was shift higher.


It occurs because of what I call «Inequality principle»

It claims: «Different price levels are not equally important for the market». Do you feel what I’m talking about? Moving average or Bollinger bands can’t distinguish what price levels are more important for the market – it’s responsibility of a trader. Missing piece is market logic.

But period in the red circle was a final auction, overall trend was rising and market was no longer able to stay inside of a trading range. When market lacks selling liquidity, when nobody is going to sell, it start advertising higher searching for sellers. We often see that price is leaning to higher extremes and holds on higher prices.

How do you think – if auction is in place, can we say that this area is equally important for the market as area from previous day? Obviously, it is not – if selling liquidity is not enough, market loses equilibrium and searches for new area where balance can be found. We may pay too much attention to this area, but Bollinger Bands respects is as any other areas –

If we rely on idea of value from Bollinger Bands, we should sell because «value» is located below price. But in fact, proper calculation should like described below: value should not slowly move up, but it should make fast «gap» and it’s location is going to be somewhere in the center of congestion

As you see, our scenario completely changes when we look at the chart this way. We now should go long, because value is going up!


Totally different scenario which tells us that even though value builds higher but overall trend and <"Context is also important">. In this case Price Breaks the range but with no momentum and we can say least that price test the high of elongated candle but that in trading terms has no . Possible words that describe this is holding the price.!

Range breakout traps are best suited with this example when price broke to the upside and then break to the downside and value again shifting to the lower site with floor finally broken as no panic to buy on the downside candles.

Tuesday, April 15, 2014

Australian dollar possible the weak after possible Top ?


Australian dollar is on its way to test the important support around 0.9200

*** here is a another update on Australian dollar movement. It is "Range bound" this week and we can possible see a test of high but as far as I am concerned we should be shorting rally now. Reason behind that setup is we have seen no momentum when pair falls and any upside rally lacks momentum

*** As I have earlier mentioned in my posts that when we saw strong patterns which don't get any follow through and buying and selling on support is probably weak holders effect and that is the reason I didn't post that chart but earlier liquidation candle followed by weak buying candles giving us a clue that possible top is in place around 0.9440 area.

*** We always look for the contribution of the strong holders and who are those holders, chart give us clue always. It's hard to spot "big player" but one thing will help you. Address yourself a question - who loses on the market? Who is caught in short or long positions? If you understand that long players are losing, you automatically know that bigger timeframe short player opposes them. Smart money players create imbalance and absorb volumes.

Popular Posts