Saturday, April 20, 2019

Concept of Random Fakeouts In Forex l Best way to trade with higher Risk Reward

Random Fakeouts to Trade Forex Hi Readers, I hope you like the recent posts and earning opportunities based on the reference to my previous post of usd/jpy. I have close the trade on +120 pips. In this post, I would like to guide you to the advance level which is "Fakeouts" and how to trade fakeouts. This would be a completely game changer for you as this often test patience but it is the best way to trade Currencies, commodities or any Market.

You must be aware of the fact that trading higher times frames or shorter time frames depends on how good you are pointing out opportunities because price is Fractal and orders are random on every time frame.

In coming days or weeks, I would Point out how to trade fakeouts on both higher and lower time frames. Price often provide opportunities or change directions when it leave orders when it left an area (often termed as exhaustion areas) & when it come back it provide with an opportunity to pick pending orders..

Basic concept is that chart speaks itself

Chart below is of Eur/Aud which is good example of how to trade a randomn fakeout. Price provide opportunities when an order is picked on the reverse side as and when price revisit the area and You should be good enough to check where to enter and where to exit & Risk to Reward.


As I have explained above that random fakeouts are good to trade but mostly there are not too many random fakeouts and Smart money or institutional traders plays trick with levels and we should be good enough to sight the levels to trade with edge and this is the first post of the series and I would keep updating you all with the rest of the things you need to be know while trading these type of fakeouts which exists usually on every time frame but we need to trade only with higher probablity and good reward to risk..

Tricks are often played in Forex

Now, lets see how price behave in this pair . Chart posted above is of Cad/chf & I'll post the live trade example once I sight an opportunity in the pair & no matter what happens, trade is on the cards, one way or the other & It playing with patience and looking to take stops hunting both side but finally there would be trade which will give us good enough pips to enjoy our life doing rest of the things & love to trade as well.

Price Action zones Explained with Real time Trade (Update on 24/04/2019)

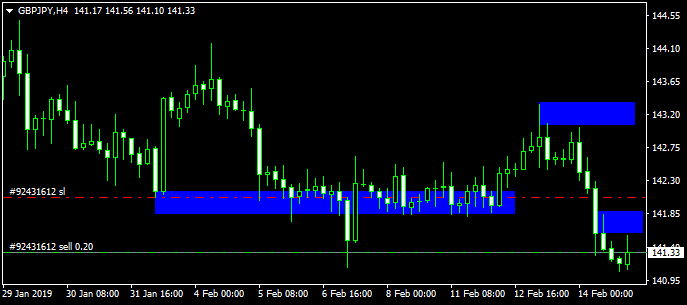
As I've already explained in the post above the we just need to remain focus on zones and trades opportunities will arrive. You just need to mark zones on every time frame and target the pairs that are trending between zones. Check the chart above and see how price action fake the zones and return to the zones and got rejected immediately and found orders. I'm currently focusing on yet another pair Cad/chf & will update the blog as soon as the opportunity is provided. In the mean time check the chart below and look back on your screens & keep focusing on zones rather than lagging indicators or another mechanical systems that are not even worth trying..


Monday, February 18, 2019

Usd Jpy Technical update Trade Opportunities & FMOC Week

Usdjpy buy opportunities with Federal open market committiee meeting Hi Readers,

It has been quite a slow moving as we just had extended weekend with USD holiday on Monday. Things will turn quite soon as we are approaching for FMOC meet late Wednesday night. No matter what the outlook would be, I would be doing what I've been doing since years & trade Charts only rather than looking for things I can't control.


Usd Technicals update against Japanese Yen


Buy Usd/jpy @ 110.70
Stops @ 109.80
Target 1st @ 112.80
Target second @ 113.48

Friday, February 15, 2019

Trading Signals of gbpjpy & Technical Update

How to trade Forex For a living Hi , Readers

I have spotted few opportunities past week but here I'm posting you the best of the setups. Things you need to look in the chart is that price tried to protect an area for few sessions and try to rally which is market as support market with blue rectangle. When price rally to supply (which will hold the price downwards), and next blue Rectangle in between has act as resistance, where first attempt ( mark as middle blue rectangle), was failed. Now I expect price to move downward towards the next support which is 139.80. So, Trade setup with stops and target is mentioned below


We Will risk 4% of the capital & target 10% Return.


Suppose if you are trading with an account $1000, then risk only $40 & Trading lot will be 0.20 Cents.
Sell gbp/jpy @ 141.40
Stops @ 142.04
Target 1st @ 140.80
Target Second 139.40

Thursday, February 07, 2019

how does the banks and institutions Trade Forex l Crude oil Future Chart

Trade Like professional banks and Institutions Hi Readers,

You all very well aware why this blog was setup i.e to help you understand the market structure and who is dominating the market. Sellers & buyers activity can be tracked on chart and that is without Indicators, Trendlines, Fibonacci or any other mechanical System. I've post couple of crude oil future chart & will soon make a video & post it below description & will guide you how you can trade like pros without putting heavy stops and incurring heavy losses if trade goes wrong.

Crude Oil Futures sold from 55.20


InstaForex

To help you understand better, hereby I'm uploading a crude oil chart & example of the trade I took yesterday & it fetch me nice 10 time rewards with only 20 pips stops.

Saturday, January 26, 2019

Forex Trading Strategies l Forex 200 & other EMA

Tradning EMA with other Indicators as trading Strategy Hi, Readers

I have update you with all the trades I took in the last few weeks and they are really going well and I've almost double my accout in 40 days. You all might have tried so many strategies and would be looking to know the reason behind my success and what strategies I'm using. I won't waste your precious time and would like to tell you that it is not possible to copy trades and learn and have same success that others are having. You need to practice risk management yourself and spend few months of demo and there are results that will shock everyone of you. That tells the truth you that every strategies gives you results whether you are trading 200 Ema, 14 EMA or 4 Ema or any indicator like RSI, MACD, Parabolic SAR .


Main reason behind success and failure in trading is greed and patience. If you patiently work with a strategy and pick couple of pairs then I would try to tell you one strategy that gives you results and that is trading 200 EMA & 14 EMA cross over trading strategy.


Indicators to be used with 200 EMA & 14 EMA


Daily pivot Indicator
Combination of 200 EMA & 14 EMA & 4 EMA apply to close
H1 Timeframe
Rules for Entering a trade with strong risk management.
Trend has to be strong on Hourly and h4 time frame. Both the EMA should be moving in the direction of the trade. Risk per trade should be not more than 2 percent of account Equity & target should be Resistance 2 & Resistance 3 and vice-e-versa for short opportunity

Pick the economic calendar and keep an eye on expected news and if there is high impact news that is due to be release, then wait till the release & get ready afterwards with the signal . All the three EMA 200, 14 & 4 EMA should be above the daily Pivot or below the daily pivot indicator.


Signal should be taken when all the three EMA's move in one direction and Crossover happens to be strong & trade is taken when price test the 14 EMA & EMA 4 should remain below or above the last 4 candles when signal is released. Stop should be support 1st or 40 pips whichever is closer & look to cover at 20 pips. By Covering, I means position should be trailed when the price reached 20 pips or cross 1st Resistance or Support. If a trade is plus 20 and a resistance or support is lying ahead and 4 candles did not manage to cross that area, then you need to close the trade. By trading this way, you won't miss any continuation of trade or start of a trend.


Money management rules are strict & Entry, Exit should be in line as explained above. Check chart below for your help.