Wednesday, February 24, 2016

WTI Crude Oil Chart and Technical Analysis Fxconfidence

Hi, Readers

Its quite a while since I have updated blog with the technical after I took my half of profit of my trade usd/jpy past Monday, But that was a risky choice as we were in the strong downtrend but Intraday less opportunity to pick up reversal can offer splendid opportunity once it really hit the trigger.

In my recent Post, I am about to post charts of Pound and Crude where I have mentioned How to read a price chart with session by session activity and serious participation of strong holders can easily be spotted out at the start of session or at the end of most active session through the day.

Take a look at pound Chart


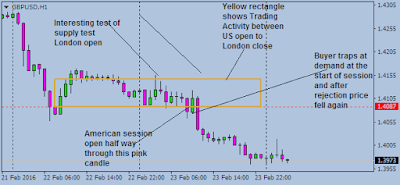
Amount of time i spend in trading supply and demand and reading session activity fits exactly to that trade when We have such Neutral activity happen through a session starts to next day session, then the next move is should be watched with absolute care and timing to pull the trigger should be at the exact time and stops and targets should always be decided.

Technical pick of the Week Crude Shorts


These two trade went according to plan and timing and selection of trading pairs was just excellent. Later during the day I would post how to find Imbalance on daily charts and How working against support and resistance can do wonders for you and You just need to remain focus with recent Gbp/Usd crashes from the open is excellent example of why I am not a very big fan of support and resistance while looking for big profits and excellent risk rewards 

Sunday, February 21, 2016

Technical Analysis of Usd/jpy Scalping Opportunities

Here lies the opportunity to scalp usd/jpy For Intraday scalpers

Buy Usd/jpy 112.80 Stops to be placed around 112.35

1st Target 113.40
TP 1 Hit Closing the half and rest at breakeven 112.80
2nd Target  113.70

Take a look at the daily chart
Forex intraday technicals, buying usd/jpy with targets and stops


TP 1 hit 113.40

Thursday, February 18, 2016

Market Hotspots are the areas where you need to react

Market Hotspots Strong entry points

In this article, I will cover every aspect where You can have some clues where Market has to react or looking to react and that is indeed is very crucial point where You need to have conscious approach and I will cover couple of chart with recent trend in Eur/usd and Possible entry coming in Crude Oil which can prove very profitable, If it reacts from here very violently.

Strong Areas of Accumulation after false break


I will cover the chart and rest of few charts that I have during weekend and possibly tell why Support and resistance self trading prophecy is so dangerous and we need to get out of that self proclaimed success system, recommend by Gurus over decades which is the worst every trading approach a trader can apply to its trading system.

Wednesday, February 17, 2016

Curde Oil Accumulation hints before data hits the market

I will update the text later

Taking profits on my crude oil longs enter in the direction of the trend yesterday.

Enjoy the chart and don't forget to check back later as I have decided to prepare a video on this soft accumulation process before market awaits data and take profit earlier but how they accumulate their position to get best price to enter is all covered in this short video.


Tuesday, February 16, 2016

Only time tell us whether there is demand or supply on approach

Enuglfing price action reaction to demand or supply

Hi, It has been series of question being put about why I sold eur/usd, after in such a strong trend, then the answer is fakeout of supply and that supply was seriously strong, while we see price hold too long from second decision, there was probability that second decision will bring some chopiness as well, Its not necessary but approach to supply was quite shaky or in supply and demand words it was compressed and now it is back to the earlier decision and it is necessary for bulls to remain in control or if it is engulfed we will see what happens on approach to and my answers is short it again then


Price chart is all about decision to decision


Price is all about one decision to another decision, Price does not change hands from buyers to sellers without decisions because it could not be possible for the others to see whether distribution has taken place, and accumulation prior to distribution is one strong example of price will lean away from zone or supply .

Only approach to supply or demand tell us what is holding

Euro Chart below tell if you see the left side to start with where we see strong levels protected before we see price flip from a S/R zone and given way to new strong rally and another decision was made just above the strong support zone before price finds support again and saw strong buy orders there and price went in to consolidation zone again and last week we see engulf of first decision before a new low was made.

If you still need explanation why price move away strongly after it touched the second decision, then You should go back and explore the blog for few weeks and find your answer. Price back to decision of breaking the supply and If we got something substantial then it would confirm the direction of euro in coming weeks probably by approach to supply or decision to engulf again.

Make things simpler in Trading

Its upto every trader, that whether he make predetermined trading moves, or look for approach and find out areas where market has behaved whether it is about scalping or whether it is on higher time frames looking for position trade.

By now you should have at least a basic understanding of how support and resistance works in the markets. It's always important to visualize support and resistance as an imbalance between supply and demand forces where demand creates support when traders show willingness to buy or readjust their expectations and start to buy at higher prices. But a weak demand also contributes to create resistance when traders disagree in buying at higher prices.