As Long as charts are not Uploading on my blogs, I have used My youtube channel to let you explain the reason of entry and exit and that video was posted on my Youtube channel yesterday and It has behave the same way which I have anticipated.
As Long as charts are not Uploading on my blogs, I have used My youtube channel to let you explain the reason of entry and exit and that video was posted on my Youtube channel yesterday and It has behave the same way which I have anticipated.
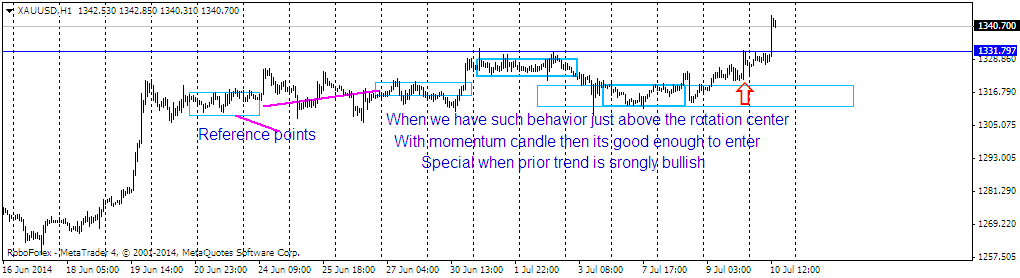
I would like to update the Gold chart as I have seen some "Strong accumulation" before the next move. In Forex trading "Momentum can reverse the trend but Only In Forex we have some strong supply and demand Scenarios which makes this place full of opportunities. My "Intraday Forex trading strategies" always tell me what I am doing and Why I am making such Observations. If you have strong downside rallies ahead of strong "Protection Area", then need to have first clue of price holding downside pressure.
In this case we have some strong protection area after the breakout(upside) around 1298.00 and After price manage to hold the higher price so strongly for few days It build up some strong "Reference Points" Marked by blue rectangle and the upside rally sustained after the test of "Accumulation Zone", the price has again start reacting at lows and also holding further downside rallies.
I would rather recommend and test of lows of failed with strong momentum coming in again and we have only one supply zone which is around "1321" and then "1336". Risk is not that much when we see any momentum coming but reward is very good and that what should be the case while we trade any currency or metal to offer you strong reward and low risk

In this chart shaded blue rectangles are the trade locations which strongly hints about the test of atleast supply zone on Intra-day basis and Price is still in range after the strong downside rally yesterday and I would recommend you to see whether we see strong breakout and test of the range and continuation of "Uptrend".
Canadian Dollar spike from the several months low was due to strong demand area as it was the are just above the protection area which is 1.0560. Risk aversion hit the market when Canadian Banks released their monthly Unemployment Data, which tells that unemployment rise during last month and rate went upto 7.1% as market was anticipating no change.
For me It is a strong hint that market has complete the correction or it could be reracement as well but In elongated trends, this type of behavior is very much on the cards and Price go through the 1.0680 supply zone with conviction and strength.
I would really try to take a closer look if that "Supply Zone" is tested again and this cross will be on the priority list to trade.
usd/cad Bounce of strong demand zone Outlook strong bullish Take a look at usd/cad Daily Chart below

I did enter after strong momentum candle spike off the lows and It could be a start of new trend again and that is why always trust and momentum and take one pair at a time specially when it One Time Frame Move (OTF)
Gold "Rise from Strong Demand Areas" And When we see movement that is going to be highly volatile and starting from inside of the trading range, it’s probably a «cascading effect» - something that is created by «fear of missing out» - many traders are chasing this movement and will lead to fast auction, raising prices higher and higher. In auction market theory it’s called "initiative break", it means that something is happening very quickly, with significant expansion in volatility, and maybe – volumes. But volumes can be not interpreted easily in this case.
When volume is increasing (or decreasing) inside of the trading range, this information can be misleading, because there are too many types of traders participating inside of the trading range – from algos to scalpers, and increased volume can be a result of those guys’ Overtrading
Gold Intraday Update as it has In strong run since low
Gold Intraday Update Cascading Effect
The idea of posting suchAnalyzing too many chart at a Time does necessarily means that you are trying to force the issues and try to capture every possible opportunity that can arrive at any time.
But things are different with "Commodities" traders that you don't have to be worried about anything else as there are two or three precious metal to remain focus as compare to "Scan" Multiple "Currencies", Which is impossible.
AS I mentioned yesterday that we have got another trade location in Australian dollar around 0.9405 Area and that was strong "Violation of rotation center" After "Accumulation", Entry was offered around 0.9410 and I was looking to take my profit around 0.9440-50 area, And After the release of "Australian Employment Report", which was mixed with Unemployment rate rise after decent People were Employed and Market was all set to test the Supply and that area was good enough for us to book the profit as price come back to opening levels of the day.
Updated chart of Australian Dollar

According to my Analysis I always look to find pairs which are trending and have logic to reach or test certain supply demand zone as Price already priced up to behave in such manner.
That is the reason I never look for reversals too early Untill there is clear evidence that trend is mature and look to reverse or correct the earlier trend.
But Australian dollar has spend so much time near the highs, this and got rejected at the trend extremes It will probably correct deeper or reverse, So Now I have maintain my neutral Bias on the pair untill Price take the Highs with conviction and convince me to enter again.