Here I would like to mention not only about how patterns repeat (not chart or any other technical patterns) But real trade location which advertises trading opportunity specially in forex when demand overcome supply and vice-versa.
I will update the usd/chf chart later on the day. Possible trade scenario for the next and if it goes right we can book some good profits
Nice weekend
and Happy Memorial Day in Advance to all my followers
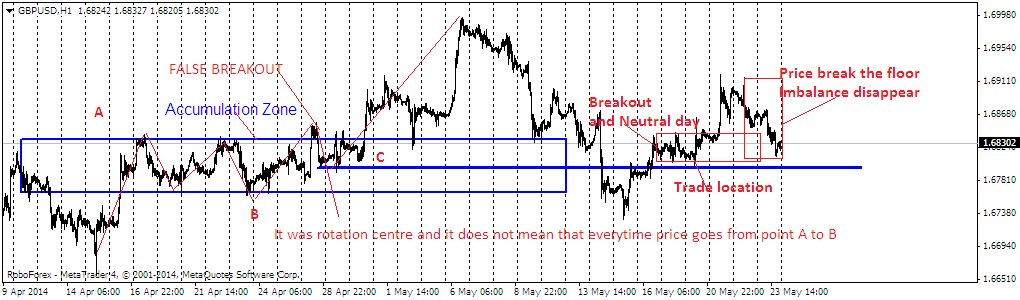
Take a look at the Chart of Great Britain Pound
Friday, May 23, 2014
Comparison between two charts for Best of trade location
Thursday, May 22, 2014
usd/chf update Are they really buying at low levels.
Here I got a clue of Usd/chf buying at low levels
Take a look at the chart !

Trading is an art , not a science and don't need to win anybody's heart by looking for trade locations as it will remain within you and your confidence level. If you always look out for such neutral activities after the strong breakouts and low tempo then don't make a mistake of trend reversal untill price break the floor.
Thursday, May 15, 2014
Usd/cad possible trade location is at the low correctional bottom

When we look for "context", then we should look at the recent price action and what it is trying to attempt , and that chart tells us that strong trend reversals has few points to consider and sideways action is totally good idea to short the rally or attempt to break and failures are the other ones.
Strong elongated candle from the lows and it was multi- month low and also it followed no trade location which could mean that smart people are looking to sell rallies in the pair. But the area which is mentioned "Extreme Supply", in the chart is an area where we should look to buy the pair as this sideways action could be a part of accumulating the recent supply from lows. I am short on the pair but only time will tell and my stops are place at 1.0940 area
Price action is very difficult to read sometime but the logic of trading should be right and there should not too much inclusion of indicators or even so many views should be taken, because trading is an approach and till you are not able to accept your strong points and weak points, it become totally impossible to trade any market All the filters should be checked (not all the indicators), such as market sentiment, profile and current demand for the subsequent pairs and then one should start trading the way market tells you to trade.
Price action suggest to short around 1.0910 area and it was good rally to the bottom but still we should look to sell rally till price is below the supply area.
Good luck, let see what happens with the pair !
Brief Explanation of Price Action Correctional bottoms
When we see, correctional bottom in strong trend and liquidation is so heavy that price start "Gravitating" towards the high, and break above it but after that we saw some strong attempts with strong bullish candles, which faded away lately and break below the correction bottom and then another break found new low.
Make or Break time for Newzealand dollar at multi-year Highs

Earlier, In My Blog posts I have discussed a lot about Possible "Trade-locations", which could be a Hot-spot area in a bracket, Multi-year highs, Intermediate false breakout, or a neutral activity after a strong breakout. First of all, the biggest example is eur/usd breakdown at multi-year high and the chart was posted and now I am looking for the same to happen in Nzd/usd. Idea is to look for high probability trades, by this I don't mean to hedge the position if price price breakout that trade-location to the upside again.
You can wait for possible more evidence or strong selling and the break of confluence and lows but as I have already spoken earlier, that always try to sell after upside breakout (beside "Context" tells you to do so)and buy after strong breakout to the downside specially when it is a responsive-activity.(By responsive activity I mean strong trend after breakout and then price goes sideways on neutral activity and break below the range of the day ) I have discussed all the "Breakouts" earlier on this blog.
Continuous efforts to rise and multiple rejections, then we saw narrow trading range which always give us strong hints, how price could behave and If our assumption is right, then probably it will be a start of larger move up or down. But as price is giving us hint that it could be a mature trend, as we have seen some strong momentum from the lows ( after breakout), certain rapid moves after intermediate false breakout and break above the multi-year high and rejection from there was strong, so short entry is advised with tight stops.
It's always better to wait for much stronger assumptions, rather than waiting for price to offer a pullback entry to join the trend(If there is any and it has already offered few of them ), because it is not a sign of versatile trader, and when price is offering a reversal or counter-trend trade like this and we have seen an that happen as an example (Eur-usd) earlier, then we should take a less "risky" trade which offer good reward .
When Trade location Inside a bracket
Price is in bracket still after false breakout of multi year high, which is a strong break above 0.8700 area, after that we have seen continuous decline on h4 and h1 chart which tells us about possible market has broken the floor and after the rejection candle we get today, which is strong bearish engulfing starting way high from yesterday's close and stops should be around 0.8680.
SO, Its always better to wait for price action to unfold in favor
Wednesday, May 14, 2014
Candlesticks patterns and Context IN predicting overall price-action
It is very important to know that what is important in predicting overall trend , Is it pattern (candlesticks or chart ) or it is the logic behind the continuation or reversals.
For me, the candlesticks or any other chart pattern or any indicator combination tells you only the 10% of the whole trend, and that statement is very disappointing because even good pattern fails and you seems to look out for reversals too early untill it happens, and you avoid those timing because of earlier stops-outs.
Context can tell you what to look out for in patterns
Context can be anything and it could be correction bottom, yearly or daily extremes and weekly extremes breakout and consolidation area at the top after breakout and you need to be extra pro-active to see what price is doing after breaking out from a level. IF price has risen from a range and reverse immediate then it is said to be neutral behavior , and it could be the case of market expecting something from fundamentals, and you can never get any entry from these type of breakouts or look for confluence areas when such activity happens.
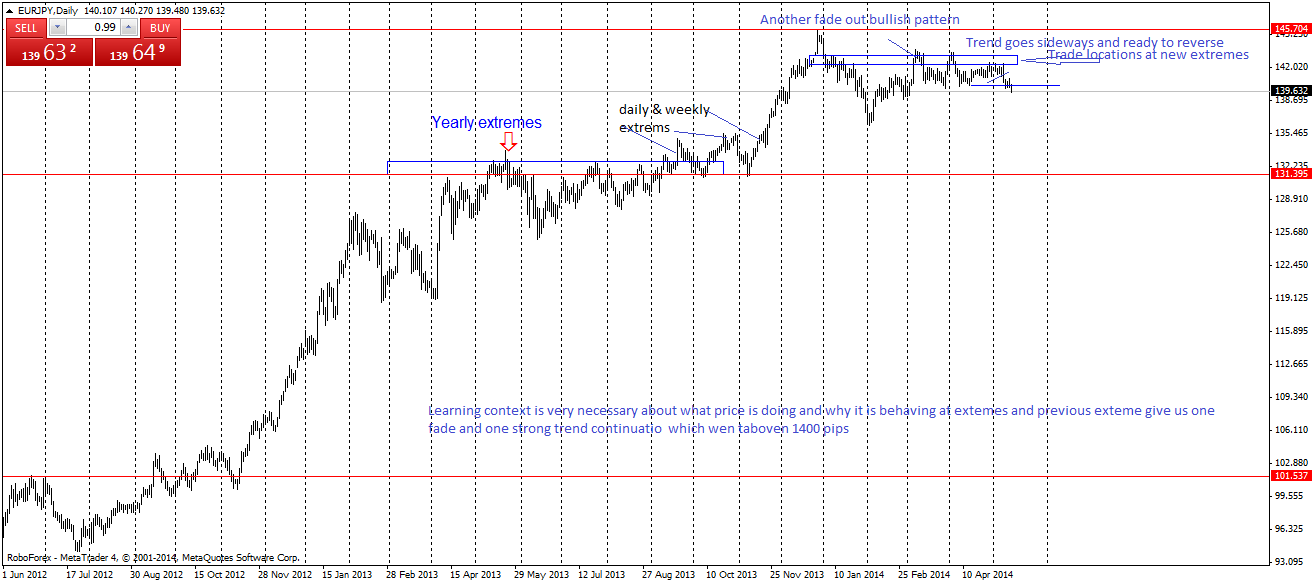
Below is eur/jpy daily chart in which I have emphasis on context
In this chart, the most important thing, is price making higher highs and holding on to those highs as well, and the conclusion one should not look for any short trade or reversals till market consolidates on large scale at top (lot of consolidation at the top area is also a strong point For reversal)Previous high was yearly extreme, and market consolidates and give one breakout of a range pattern, which was strong one ans was faded out, but there we never get any strong liquidation which means that price can rise of from the low and this could be a swift move, and that exactly happen with a large breakout and test of that breakout.
Now we have seen the new price extreme and multi-year high and that high has been holding further development of price and price is in range after strong down movement and After going sideways price has managed to give strong breakouts of the range at top which faded out earlier, but support is holding . After strong tests price has manage to fall swiftly of that trap of strong above the high reversal pattern, and that type of patterns reverse the price most of the time and even this time price has faltered again and fall more than 300 pips.
Check the chart below !
So, the idea to post the above chart is not to derail anybody or discourage anybody from whatever he or she might be adopting, to predict the price action, but to tell you the most important point that is missing in your trading, i.e logic and when you know the logic behind the trading you can have few losses and that would be small one but your profit factor would be huge and you will how to ride the most part of the trend.
Subscribe to:
Posts (Atom)