Friday, October 24, 2014

Candlesticks Patterns Continuation And Reversals

Intraday trading with Candlesticks

Candlesticks Trading

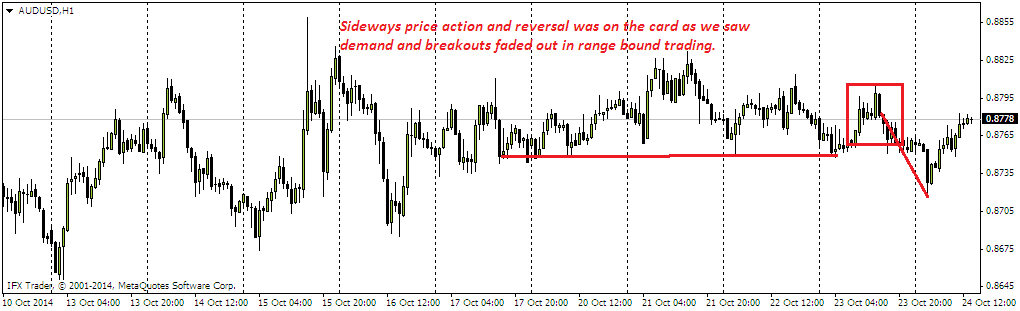
I was busy during the weak but I saw an opportunity to explain the Role of simple "Candlesticks patterns", and doing it by posting an example. In the above chart we seen that price has been in range and try to rise off demand areas and all the attempts are either faded out or either don't had any follow-through.

When we trade such scenarios we need to see overall relation of candlesticks with the context, As seen in the chart price has been bullish on the pattern breakout and then next candle almost completely engulf the prior breakout candle and opportunity was offered.

I would try to cover most of candlesticks patterns which offer continuation or reversals in the next post of my blog and other trading segments and aspects as well.

Saturday, October 18, 2014

Price Action Without Candles

Price Action and its types

Hi traders! I am bit busy these days but still I always try to give my best to cover most aspects of trading and its style and During next week I will try and cover several aspects of trading as mentioned below.

*Momentum Trading

* No supply Imabalance

*Candlesticks Pattern traps.

*Context reading overall picture

*Trend confirmation after correctional bottom.

*Price Action in Balance Market conditions.

*Overbought and Oversold Market conditions.

*Roll Of Indicators.

*Breakouts and its types

I will try and cover each and every style with examples so next week its the best way to watch price action techniques which is really helpful in determining the versatility of a trader, and helpful aspects of trading.

Thursday, October 16, 2014

Intraday scalping Opportunitiy

Intraday Scalping techniques

I try to make my blog posts as easy to understand as for me trading is more art than science and I never try to complicate things and If you have continously watch the updates, then It should have helped you enhance you trading knowledge and develop a lot of skills.

Scalping Need consciousness and easiest way around


When we saw strong trends tries to reverse and Had several attempts to back off from supply area and again tries to build momentum third time, then it is know as triple Initiative break and that type of breaks are clear form of "Imbalance", Where market went against the strong money and again driven back to areas where previous sell-off happened.

It is so important that we remain patience and look to go with trend unless we find this type of chart which tells you that infact a reversal is on the cards, And it happens with strong Initiative break which happens in this case of pound dollar chart.

Hints when Imabalnce is forming

Market clues when imbalance is forming

Example of usd/jpy : Strong Imbalance

I have try my best to keep this blog updated on every clue of Where "Strong Institutional buyers" are eyeing to step in the market and absorbed the whatever supply there is and "Imbalance" is first clue of any such activity happening.

Even though we are in strong trends market and we saw some candlesticks patterns then it is not necessary it offers continuation of trend as for me candles at adverse market conditions are traps (most of them), unless you saw strong "rotation center" Violation and prior trend is strong to sideways for number of days.

So, pattern is the lower level in decision making process, the higher level is understanding context. We can't really evaluate our decision if we always operate from lower level of this process. It is only possible to evaluate it when we try and understand what patterns is offering and what prior market conditions is and overall context is also very important.

Price Trend reversals In Rangebound Market conditions

Price Trend reversal after false breakout patterns

We have seen massive volatile market conditions after the release U.S retail sales data yesterday But It did not matter a lot to me because I hardly watch any news and watch charts and behavior of strong money and When you look for such strong moves it hardly had carry through and Eur/usd reversal off from supply area ends the day with giving away half the gains.

In order to look for massive opportunities in such big moves day one should be ready to look out for entries that suits you trading style otherwise there is no reason You should try to enter without any knowledge and stops get hit so many times after you enter.

Take a look at the nzd/jpy chart

Trader's assumptions don't pay and this is the truth of trading as You should be ready to step in when such strong movement days don't push the price of certain pairs and price end up with false breakouts as traders who left behind try to force the price higher but where strong money is eyeing to sell and get a better price, they will do it with ease and that is what "liquidation" is all about.

I would update the chart if I am stopped out after any exhaustion bar or any reversals as we should be ready if market finds demands again and price look to get momentum .