Tuesday, July 08, 2014

Are candlestick alone reliable for pullback entries ?

How candlesticks patterns trap traders

How Candlesticks trap traders,Why candlesticks alone are not reliable, Candlesticks Trap action, Candlesticks don't help in long term

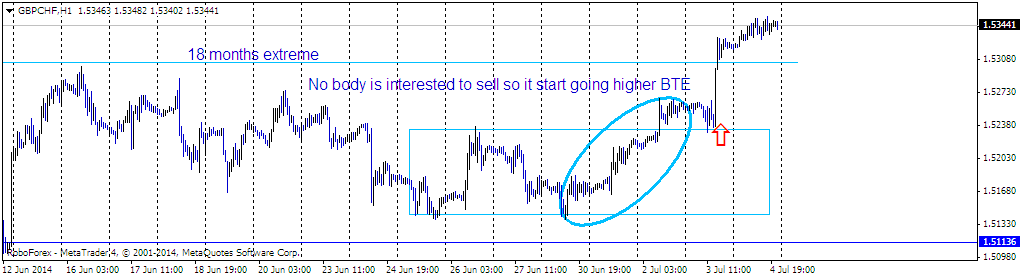
Trader relaize Length of Candles were not big enough

Why I always think that candlesticks are the least important things in considering pattern outlook. I have heard from lot of newbies and experienced traders that candlesticks "Price action" is the best way to trade, But for me it has the least important factor in determining the trend outlook.

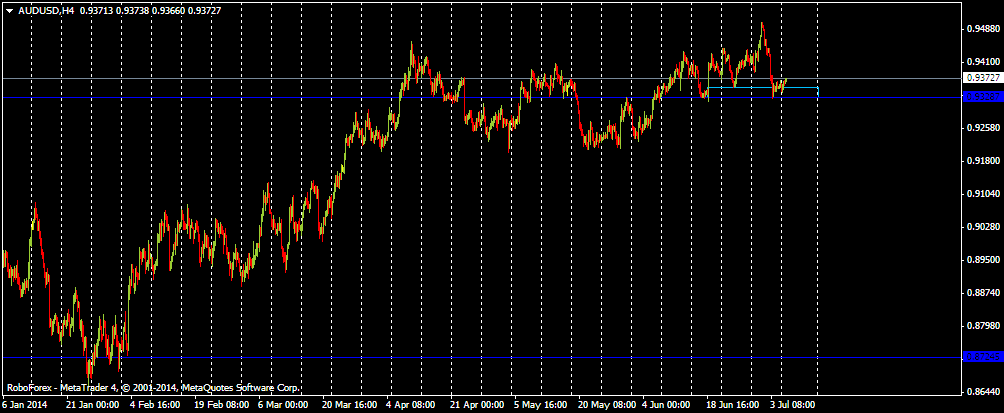
When traders saw strong Momentum against the trend,Then traders quickly start observing that it is the end of the trend and Price is reversing, But smart money never react that way, they rely on liquidation to reverse the trend, or to continue as they always try to accumulate their orders and always look to buy low again and stat building on their position slowly.

Same thing has happened in bearish reversals as they always give you better low price to enter and Traders realize that we are getting another chance to buy the Inventory at low prices, And bang they sell with even more forces and that is what has happened in the chart mentioned above.

Monday, July 07, 2014

Australian dollar another demand level could be eyed

Another opportunity might be on the cards for Australian dollar

I have taken a closer look on the cross last weekend, and waiting for demand level in Australian Dollar which could be eyed by Strong buyers, But the reason I am not too much eager about the setup is that due to strong selling pressure from multi month high.

But as I have mentioned I always look for setups that give clear indication of continuation and In this pair there is one on the cards offering pullback.

In the chart, I have seen some strong reference points which holds the highs and higher highs were posted and strong liquidation which has not yet picked up momentum,but it could be a part of extended accumulation. Strong points are :-

1. Price has strong protection area mentioned by blue line

2. Price close the week on lows at demand area

3. Price holding the demand level after strong selling which could be a part of strong accumulation.

Take a look at the chart below

All the traders who trade technicals and contribute a lot and achieved a lot and have confidence that setup has strong logic and reason to enter and exit. And same thing has happened here for me, as there is no strong supply but a little one around 0.9440-50 area which was previous top and stops could be place around 0.9330 in case any whispaw that will protect the entry .

Friday, July 04, 2014

Gbp/chf Breaks the equilbrium and momentum was again shifted

Trade what you see don't what you expect gbp/chf technical update,Intraday updates, final auction strong technical reason outlook still bullish, buy on dips.

gbp/chf strong push to the upside after strong consolidation Intraday update

For those who did not see my earlier post take a look at here

First thing we do when we see a chart is to see what is the main trend, and when we have some strong background not too historic one but has happened just recently, and price start moving in the direction of the main, we start observing that whether or not the resistance o support will hold.

But when we see that type of chart where swing from low is strong and corrections are getting smaller, then we should wait for the final push and test and that is what happened in the cross and I was first to point out that franc weakness against strong pound is imminent and my doubt became more evident when price break the 18 months extreme and weekly and daily extreme on hourly chart.

Most important thing we do before we pick any particular chart is that what is the main trend and whether or not imbalance is still present in the market and the answer is yes, Imabalance is still present in the market .

When we see strong swing and price behave with low tempo when it start correcting then we need to just pick that type of chart and start looking for trade locations which was offered with the strong push through previous "consolidation range", and then price test and then spike was so strong it gone through all the barriers and in no time it climbed up more than hundred pips.

Are we seeing continuation of downtrend in Euro !

Trend continuation after correctional bottom.

Are we seeing "Trend continuation to the downside Rally", Are we really seeing another attempt to downside for the Euro, And if I am correct, Then soon we will see the test of correctional bottom.

Downtrend continuation confirmation, rising attempts have been failed

The idea I post earlier was that We have seen rapid liquidation after strong trend which means at-least one attempt to test the high and Very often price gravitates to the upside.

when we see such attempts, But all the attempts have been faded out and Now we will soon see another low in the trend.

In order to invalidate this Rally, we will have to break above 1.3695 and see an attempt to rise once again. But current rally and attempt to rise have been failed so far and the outcome is test of lows and possibly new low.

Thursday, July 03, 2014

How much importance does context have In GOld Rally

Gold weak buyers breakout or correction

Gold rally from lows is very strong and It has stalled and spent so much time near these areas, In order to point that strong holders are in dominance one should look to spent time near highs but breakout and shift in momenutum has nothing to do this time.

May be strong holders left the rally around this areas and recent breakout has been done by weak or small position traders and IF that is correct, we should soon see strong liquidation today or days to come.

I would bet on that sell-off today because of lot of high Impact News, First ECB rate decision and then "Non Farm Payrolls".

In the chart below I have pointed whether the recent breakout has been hold by "Strong holders", and if that the case they won't let sellers to get hold and will keep moving the price higher immediately after the Momentum fades out by price again breaking below the upper boundary of "Blue rectangle".

False breakouts, reversals pattern, logical trading, reading overall context in gold chart

Gold Chart Possible false breakout followed by reversal

Simple rules when price spent so much time near highs then it works as double edge swords that whether strong holders are no longer interested, then it is overtaken by small holders and they continue to buy on dips and make a breakout but then immediately strong holders make their presence and create massive liquidation and that could be the case here as well in Gold chart.