Monday, April 21, 2014

First clue of institutional activity is acummulation on moving market


Reading price action, it's important for us to estimate - is this action a result of institutional activity or result of any other activity?

First of all, let's break some popular myths.

Myth

Rapid move is a sign of big money buyer or seller.


Of course, in some cases, after news announcements or forced by circumstances, institutional buyers or sellers can enter the market this way,

But it would be a messy trade and their clients would not appreciate it. Yes, sometimes they are forced, sometimes they have no choice, but more often than not, they don't do it.

They need to build a position before.

So, if we see a rapid move, what is it?

It is emotional reaction of the market - it is a sign of crowd. Traders are acting in sync with each other and create a crowd.

More often, rapid move is a result either a short-coverage (move up) or long liquidation (move down).

WILL price action continue after rapid movement?

Actually, nobody knows that. It will depend on various factors and I would not bet money on it. Traders in whole are driven by linear logics. For example: "we see something volatile, it's a sign of big guys going to one direction". It doesnt' work that way. Big guys try to be ahead of the crowd.

But IF there is a continuation of a rapid move AND series of new highs/lows, than probably it can be a sign of a single big player.

Why? Because market continues building in the favor of previous breakout, it often happens when sellers are too weak and can't create enough pressure to drive prices back to previous range.

So, you know already that big guys rarely come to the market and buy all they want. They need to build their positions, sometimes in sideways market, sometimes on moving market. It's called accumulation. The opposite process (when they cover their positions) is called distribution. That's how market mechanics works.

For example, if big buyer participates the market

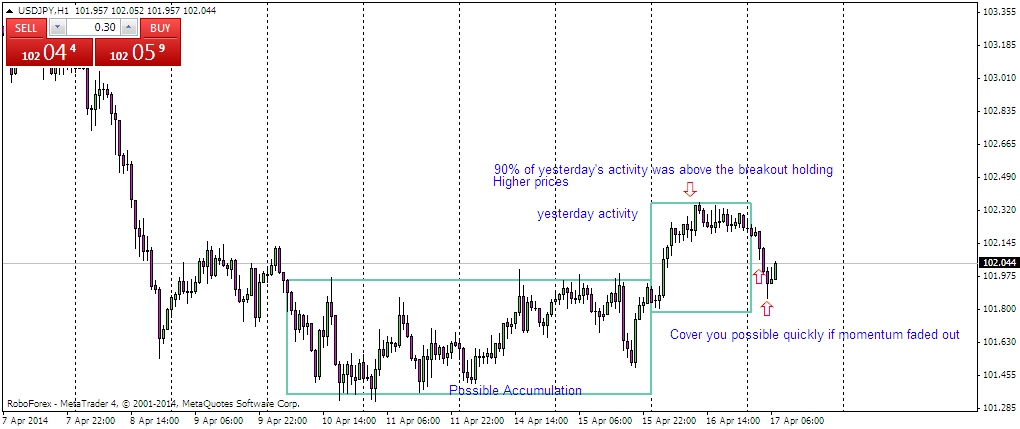
Big player accumulates positions, market is temporarily oversold on weak side, it breaks out from the range of accumulation, then rapidly pulls back, levels below are protected, market is bought out and highs are retested.

If later on we see market "leaning" on higher prices, it's a sign of possible imbalance - buyer is in control and if seller will not step in, market will continue renewing highs.

Then you may see pullback again and if market "drills" lower prices, imbalance is possibly disappeared - your opportunity no longer exists.

Take a look at this chart where there was Imbalance which disappears when market break the floor.

Sunday, April 20, 2014

Trading Price Action basics buying at lower level.


Strong holders vs weak holders

Ok, now if we have distinguished weak holders from strong holders.

And what we really have to do - we want to know, at least to assume what professional players are doing. By professional players I mean dealers or institutions that have to consistently deal with big volumes and give their clients at least average good fills.

Institutional activity or strong Holders

When we are talking about institutional activity, we are talking about strong holders. That guys have almost unlimited buying power at their disposal, but it doesn't mean that they want take money from you, they usually have large order from their clients. It not always means that they want to purchase from weak holders, squeeze them and hunt for their stops.

They just want to accumulate position not squeeezing price against themselves.

Example of Trading Activities

First of all, if you look at this chart, how do think, where (on what prices) institutional player was buying (if he was buying at all here)?

Expected answer is that they were buying at lower level.

But think about their volumes. They are big enough, and they simply would not have enough liquidity to build a position there. They usually have to accumulate - to buy several times, to absorb somebody's sell orders. Otherwise, they will not have enough liquidity and make prices grow immediately up.

Prediction price action with indicators


Most of you know me as a chart trader, operating almost without any indicators. But to synchronize our languages, I’ve decently webinar called «Price action and indicators». There I was talking about possible use of indicators – what indicators can be useful in trading?

First, of all, remember one simple thing:

Indicators do not identify any trend, they don’t tell you «what», they tell you «how». The hypothesis about possible trend is your responsibility. I’ve said "hypothesis" because there’s nothing to be sure about, and best traders know that they don’t know. They might think they know, but in reality they don’t know.

It’s very complicated question – how to identify a trend (trend that will tend to continue), I suggest that you read my posts called «Price action basics» in this section.

But once you’ve identified a trend, you can use indicators to fine-tune your entry, to pick better trade location, to calculate a stop or profit taking level. But they don’t do the job of identifying a trend for you.

Friday, April 18, 2014

Basics of Price Action applies only on forex or currency market.


Trading the market, you want to see something beyond candlestick charts, and you want to see - guess what? You want to see people, traders with their interests, fears and desires. Like one wise man said, "discover what makes people tick, and you will know what makes market tick"

Where are you trading?

First of all, there is a significant difference between stock market and markets that trade with leverage. Forex is one on those markets (but not the only one - there are futures, options, OTC derivatives and so on).

Nature of retail Forex market is that real currency rarely trades here. We trade obligations (for example, we take responsibility to buy some currency after the trade, and deposite some money fot that. If we are mistaken, we give some money to the market, if we are right - we take some money from the market).

Numerous obligations (traders from retail traders) meet together and form a huge whole position, that liquidity provider must cover using other liquidity provider. That's how it works.

! The process of exchanging obligations is somewhat different from exchanging real goods.

Things are different in stock Market

Imagine you're trading a stock. Quantity of stocks is limited, and to go short you must borrow some stocks from its' owner. If you want to close your long position, you expect somebody to sell it (real stock). And that's why we have "short interest" on the stock market, it usually doesn't exceed 5% of the whole volume.


Things are different on Forex and futures.

You can sell almost unlimited number of contracts, so you don't need to borrow something from somebody. That circumstance makes analysis of supply and demand on Forex pretty different than on stock market.

We can see big supply, but suddenly market reverses and all those short sellers start covering. Why? Because they need to do it - they have small pockets and should exit quickly otherwise they can blow up their accounts.

The same is with long positions - there are lots of weak holders, that have very close "pain point" - they go long, place very close stop and if they have no defense from "strong holders", market will probaly go after their stops, because there is always strong counterparty that can hold the level and prevent price from further rising (remember - they can place as many "sell limit" orders as they want.


Trading on Forex market is really the Art of analysing underlying inventory.

To start successfully find good trades, we should answer these questions from small check-list:

1. Who is responsible for price action? Strong holders or weak holders? (price will go in the favor of strong holder)

2. Is market oversold or overbought on the way up? (in the first case we have weak short sellers, in the second - weak long bueyrs)

3. Is market oversold or overbought on the way down? (in the first case we have weak short sellers, in the second - weak long buyers)

As a trader, you should know how to read inventory and to play on the strong side.
Remember, there are not only situations when we have "win-lose" situation and "strong-weak" market configuration, we can also have "strong-strong" market configuration, when market is careless about retail traders and their positions (this is when we have elongated trends).

As a trader, you should know how to read inventory and to play on the strong side.

Thursday, April 17, 2014

Australian dollar and Newzealand dollar Short Scalps in Range Bound Trading


new zealand dollar price action update

Little update on downtrend resumption as I was eager for that trade and emphasis a lot on this setup for the past two days. Take a look at the chart and decide what one could have done wrong when someone is aware of "distribution". Take a look at the update chart below !

scalp opportunity of kiwi dollar as imbalance disappears in strong trend

As I mentioned in my previous post about imbalance and difference between short term scalps and swing trading offer lot of opportunities as mentioned in Post. Check it my last post Here !!

Short term momentum does give us lot of opportunity as we are told from start that we should trade what we see. Here I go short with the trading range as price action in ranges are quite repitative and when we dont find enough buyers in short term picture then price keep looking to strong demand areas to find how crowd reacts there.

Here is I have mentioned that longs were trap with strong range breakouts with bullish engulfing and price test the area and immediate covering was found and lot of downside momentum as well.


Here is the another classic example of buyers finally give away in range-bound trading and price finally repeat the price action again and range breakouts again to the upside and then again after find strong short term buyers sellers again step in and move the price to the downside again to the support 0.9340
Check it here!!


When suppliers can't move the price immediately specially because of strong uptrend then they will liquidate their position with strong bullish engulfing bar to sell from better price and Australian dollar move today was a perfect example of today, although second trap was much more valid as first was overlapped but idea was too sell with a strong bulk orders.

Take a look at the chart below !!


Momentum give you another entry to enter again as I mentioned in my previous post that we need to cover but next candle break above that faded out candle.


Take a look at the chart I posted first on the blog, Here I mentioned that price has spend 90% of the range to the upside, yesterday and when it happens and market is moving down slowly and certainly it find strong momentum from the previous day "Minor development Area", then we get a good high risk reward oppotunity to enter on momentum as I did here and I had to cover with only 12 pips.

Take a look at the chart !

As I have mentioned in my previous chart we should cover over position with strong momentum candle which was faded out and another bar could let you enter again as there are best chances of momentum to carry throughout the day as it did.

Take a look at the chart Below !!