I have continously mentioned in my posts that we should look to find out "context" which is highly important in deciding the faith of a trader and the next predicted Move .
This type of trading give you an edge over other "mechanical systems" where the focus is totally shifted on any predetermined indicator's value.
The reason I have mentioned before putting an update is because pattern was repeated in "sterling" chart, I mentioned last time I update the blog. Sign of "strength" is always when we see "accumulation" at the lows and then we saw breakouts followed by protected levels.
but when we see continuous highs and and Price holding higher prices, the it is totally could be the case of "accumulation" on the moving markets and Friday we have seen buying at low levels as well.
Update of franc chart tells us another move could be strong
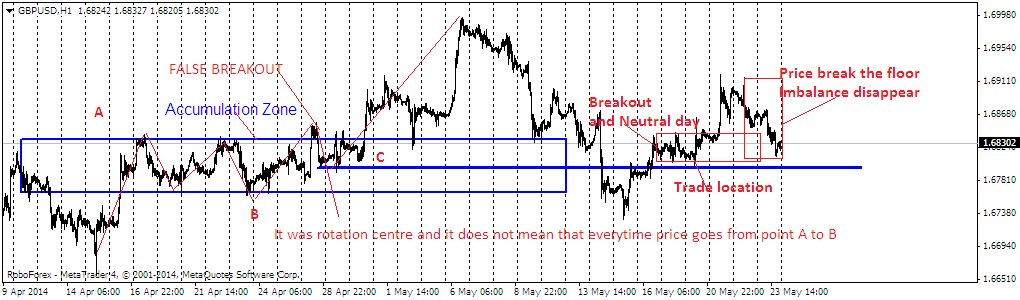
I have mentioned all the important factors in this chart, which could lead to strong moves and I have not mentioned any support because there is not a sign of strong liquiation and that is in itself a sign of extreme strength, but one should not see panic in the mind of traders otherwise that imbalance that has been created would disappear,

Little update on the chart as I discuss earlier , recent activity does tell us that price is still moving in the accumulation period and any strong selling here and momentum arrives again then we should fade that liquidation.
Check the update chart !